Cluster Monitoring and Alerts
Prerequisites
- OpenShift 4.6 on VMware 6.7 U3+ or 7.0
- VMware Cloud Native Storage to support CNS CSI
- OpenShift installer
- Node subnet with DHCP pool
- DNS
- NTP
OpenShift Mornitering and Alert
OpenShift Container Platform includes a pre-configured, pre-installed, and self-updating monitoring stack that provides monitoring for core platform components. OpenShift Container Platform delivers monitoring best practices out of the box. A set of alerts are included by default that immediately notify cluster administrators about issues with a cluster. Default dashboards in the OpenShift Container Platform web console include visual representations of cluster metrics to help you to quickly understand the state of your cluster.
The OpenShift Container Platform monitoring stack is based on the Prometheus open source project and its wider ecosystem. The monitoring stack includes the following:
Default platform monitoring components. A set of platform monitoring components are installed in the openshift-monitoring project by default during an OpenShift Container Platform installation. This provides monitoring for core OpenShift Container Platform components including Kubernetes services. The default monitoring stack also enables remote health monitoring for clusters. These components are illustrated in the Installed by default section in the following diagram.
Components for monitoring user-defined projects. After optionally enabling monitoring for user-defined projects, additional monitoring components are installed in the openshift-user-workload-monitoring project. This provides monitoring for user-defined projects.
Default monitoring targets In addition to the components of the stack itself, the default monitoring stack monitors:
- CoreDNS
- Elasticsearch (if Logging is installed)
- etcd
- Fluentd (if Logging is installed)
- HAProxy
- Image registry
- Kubelets
- Kubernetes apiserver
- Kubernetes controller manager
- Kubernetes scheduler
- Metering (if Metering is installed)
- OpenShift apiserver
- OpenShift controller manager
- Operator Lifecycle Manager (OLM)
Configuring the monitoring stack
The OpenShift Container Platform 4 installation program provides only a low number of configuration options before installation. Configuring most OpenShift Container Platform framework components, including the cluster monitoring stack, happens post-installation.
You can configure the monitoring stack by creating and updating monitoring config maps.
Procedure
Check whether the cluster-monitoring-config ConfigMap object exists:
oc -n openshift-monitoring get configmap cluster-monitoring-configIf the ConfigMap object does not exist:
Create and apply the following YAML manifest. In this example the file is called cluster-monitoring-config.yaml:
cat <<EOF | oc apply -f -
---
apiVersion: v1
kind: ConfigMap
metadata:
  name: cluster-monitoring-config
  namespace: openshift-monitoring
data:
  config.yaml: |
    enableUserWorkload: true
    prometheusK8s:
      retention: 7d
      externalLabels:
        region: sea
        environment: dev
      volumeClaimTemplate:
        spec:
          storageClassName: thin
          volumeMode: Filesystem
          resources:
            requests:
              storage: 40Gi
    alertmanagerMain:
      volumeClaimTemplate:
        spec:
          storageClassName: thin
          resources:
            requests:
              storage: 5Gi
---
apiVersion: v1
kind: ConfigMap
metadata:
  name: user-workload-monitoring-config
  namespace: openshift-user-workload-monitoring
data:
  config.yaml: |
    prometheus:
        retention: 12h
        resources:
          requests:
            cpu: 200m
            memory: 1Gi
EOF
Managing alerts
In OpenShift Container Platform 4.6, the Alerting UI enables you to manage alerts, silences, and alerting rules.
Alerting rules. Alerting rules contain a set of conditions that outline a particular state within a cluster. Alerts are triggered when those conditions are true. An alerting rule can be assigned a severity that defines how the alerts are routed.
Alerts. An alert is fired when the conditions defined in an alerting rule are true. Alerts provide a notification that a set of circumstances are apparent within an OpenShift Container Platform cluster.
Silences. A silence can be applied to an alert to prevent notifications from being sent when the conditions for an alert are true. You can mute an alert after the initial notification, while you work on resolving the underlying issue.
Understanding alert filters
In the Administrator perspective, the Alerts page in the Alerting UI provides details about alerts relating to default OpenShift Container Platform and user-defined projects. The page includes a summary of severity, state, and source for each alert. The time at which an alert went into its current state is also shown.
You can filter by alert state, severity, and source. By default, only Platform alerts that are Firing are displayed. The following describes each alert filtering option:
Alert State filters:
- Firing. The alert is firing because the alert condition is true and the optional for duration has passed. The alert will continue to fire as long as the condition remains true.
- Pending. The alert is active but is waiting for the duration that is specified in the alerting rule before it fires.
- Silenced. The alert is now silenced for a defined time period. Silences temporarily mute alerts based on a set of label selectors that you define. Notifications will not be sent for alerts that match all the listed values or regular expressions.
Severity filters:
- Critical. The condition that triggered the alert could have a critical impact. The alert requires immediate attention when fired and is typically paged to an individual or to a critical response team.
- Warning. The alert provides a warning notification about something that might require attention in order to prevent a problem from occurring. Warnings are typically routed to a ticketing system for non-immediate review.
- Info. The alert is provided for informational purposes only.
- None. The alert has no defined severity.
- You can also create custom severity definitions for alerts relating to user-defined projects.
Source filters:
- Platform. Platform-level alerts relate only to default OpenShift Container Platform projects. These projects provide core OpenShift Container Platform functionality.
- User. User alerts relate to user-defined projects. These alerts are user-created and are customizable. User-defined workload monitoring can be enabled post-installation to provide observability into your own workloads.
Sending notifications to external systems
In OpenShift Container Platform 4.6, firing alerts can be viewed in the Alerting UI. Alerts are not configured by default to be sent to any notification systems. You can configure OpenShift Container Platform to send alerts to the following receiver types:
- PagerDuty
- Webhook
- Slack
Routing alerts to receivers enables you to send timely notifications to the appropriate teams when failures occur. For example, critical alerts require immediate attention and are typically paged to an individual or a critical response team. Alerts that provide non-critical warning notifications might instead be routed to a ticketing system for non-immediate review.
**Set up Test Mail Server and Slack Channel
Before we configure the AlertManager to send email and slack alert, we will need to run a webmail with smtp and slack channel for testing
Deploy the maildev in default namespace and expose webmail
oc project default
oc new-app --docker-image=maildev/maildev --name='maildev'
oc expose service/maildev --port=80
From this deployment you can reach smtp via
maildev.default.svc.cluster.local:25and webmail from route host using commandoc get routeCreate Slack Channel webhooks token, or use prepared token you have
Webhook notification with line-notify-gateway You will need to setup Line Notification service to allow Line Notifications in your chat group. After you setup you will get your token to use in AlertManager webhook to
line-notify-gatewaycontainer, which is provided as an example for receive AlertManager webhook json and send to Line Notification Service.oc -n default new-app --docker-image=nontster/line-notify-gateway oc -n default get svc
Configuring alert receivers
Procedure
In the Administrator perspective, navigate to Administration → Cluster Settings → Global Configuration → Alertmanager.
You can apply Alert Receivers configuration example that includes receivers for smtp to webmail, slack and line-notification-gateway.
 cat <<EOF | oc apply -f -
 kind: Secret
 apiVersion: v1
 metadata:
   name: alertmanager-main
   namespace: openshift-monitoring
 data:
   alertmanager.yaml: >-
     Z2xvYmFsOgogIHJlc29sdmVfdGltZW91dDogNW0KICBzbXRwX2Zyb206IG9jcEBleGFtcGxlLmNvbQogIHNtdHBfc21hcnRob3N0OiAnbWFpbGRldi5kZWZhdWx0LnN2Yy5jbHVzdGVyLmxvY2FsOjI1JwogIHNtdHBfaGVsbG86IGxvY2FsaG9zdAogIHNtdHBfcmVxdWlyZV90bHM6IGZhbHNlCiAgc2xhY2tfYXBpX3VybDogPi0KICAgIGh0dHBzOi8vaG9va3Muc2xhY2suY29tL3NlcnZpY2VzL1QwMUJBNVoxUUczL0IwMUpEMEZTSzVXL01kWGJpTlpxRjVVTlZ1MWtReWE2dEFlRgppbmhpYml0X3J1bGVzOgogIC0gZXF1YWw6CiAgICAgIC0gbmFtZXNwYWNlCiAgICAgIC0gYWxlcnRuYW1lCiAgICBzb3VyY2VfbWF0Y2g6CiAgICAgIHNldmVyaXR5OiBjcml0aWNhbAogICAgdGFyZ2V0X21hdGNoX3JlOgogICAgICBzZXZlcml0eTogd2FybmluZ3xpbmZvCiAgLSBlcXVhbDoKICAgICAgLSBuYW1lc3BhY2UKICAgICAgLSBhbGVydG5hbWUKICAgIHNvdXJjZV9tYXRjaDoKICAgICAgc2V2ZXJpdHk6IHdhcm5pbmcKICAgIHRhcmdldF9tYXRjaF9yZToKICAgICAgc2V2ZXJpdHk6IGluZm8KcmVjZWl2ZXJzOgogIC0gbmFtZTogQ3JpdGljYWwKICAgIGVtYWlsX2NvbmZpZ3M6CiAgICAgIC0gdG86IGFkbWluQGV4YW1wbGUuY29tCiAgLSBuYW1lOiBEZWZhdWx0CiAgICBlbWFpbF9jb25maWdzOgogICAgICAtIHRvOiBhZG1pbkBleGFtcGxlLmNvbQogIC0gbmFtZTogbGluZS13YXJuaW5nCiAgICB3ZWJob29rX2NvbmZpZ3M6CiAgICAgIC0gdXJsOiA+LQogICAgICAgICAgaHR0cDovL2xpbmUtbm90aWZ5LWdhdGV3YXkuZGVmYXVsdC5zdmMuY2x1c3Rlci5sb2NhbDoxODA4MS92MS9hbGVydG1hbmFnZXIvcGF5bG9hZD9ub3RpZnlfdG9rZW49aG1OODlpUU1qTTNubE1IVkRaNnc3Y0t1S0RVaWZwd21tdzhvNGVwMTNTQwogIC0gbmFtZTogbGluZS13YXRjaGRvZwogICAgd2ViaG9va19jb25maWdzOgogICAgICAtIHVybDogPi0KICAgICAgICAgIGh0dHA6Ly9saW5lLW5vdGlmeS1nYXRld2F5LmRlZmF1bHQuc3ZjLmNsdXN0ZXIubG9jYWw6MTgwODEvdjEvYWxlcnRtYW5hZ2VyL3BheWxvYWQ/bm90aWZ5X3Rva2VuPWhtTjg5aVFNak0zbmxNSFZEWjZ3N2NLdUtEVWlmcHdtbXc4bzRlcDEzU0MKICAtIG5hbWU6IHNsYWNrCiAgICBzbGFja19jb25maWdzOgogICAgICAtIGNoYW5uZWw6ICcjYWxlcnQnCiAgLSBuYW1lOiBzbGFjay13YXJuaW5nCiAgICBzbGFja19jb25maWdzOgogICAgICAtIGNoYW5uZWw6ICcjYWxlcnQnCiAgLSBuYW1lOiBzbGFjay13YXRjaGRvZwogICAgc2xhY2tfY29uZmlnczoKICAgICAgLSBjaGFubmVsOiAnI2FsZXJ0JwogIC0gbmFtZTogV2FybmluZwogICAgZW1haWxfY29uZmlnczoKICAgICAgLSB0bzogd2FybmluZ0BleGFtcGxlLmNvbQogIC0gbmFtZTogV2F0Y2hkb2cKICAgIGVtYWlsX2NvbmZpZ3M6CiAgICAgIC0gdG86IHdhdGNoZG9nQGV4YW1wbGUuY29tCnJvdXRlOgogIGdyb3VwX2J5OgogICAgLSBuYW1lc3BhY2UKICBncm91cF9pbnRlcnZhbDogNW0KICBncm91cF93YWl0OiAzMHMKICByZWNlaXZlcjogRGVmYXVsdAogIHJlcGVhdF9pbnRlcnZhbDogMWgKICByb3V0ZXM6CiAgICAtIHJlY2VpdmVyOiBXYXRjaGRvZwogICAgICBtYXRjaDoKICAgICAgICBhbGVydG5hbWU6IFdhdGNoZG9nCiAgICAtIHJlY2VpdmVyOiBDcml0aWNhbAogICAgICBtYXRjaDoKICAgICAgICBzZXZlcml0eTogY3JpdGljYWwKICAgIC0gcmVjZWl2ZXI6IFdhcm5pbmcKICAgICAgbWF0Y2g6CiAgICAgICAgc2V2ZXJpdHk6IHdhcm5pbmcKICAgIC0gcmVjZWl2ZXI6IHNsYWNrCiAgICAgIG1hdGNoOgogICAgICAgIHNldmVyaXR5OiBpbmZvCiAgICAtIHJlY2VpdmVyOiBzbGFjay13YXRjaGRvZwogICAgICBtYXRjaDoKICAgICAgICBhbGVydG5hbWU6IFdhdGNoZG9nCiAgICAtIHJlY2VpdmVyOiBzbGFjay13YXJuaW5nCiAgICAgIG1hdGNoOgogICAgICAgIHNldmVyaXR5OiB3YXJuaW5nCiAgICAtIHJlY2VpdmVyOiBsaW5lLXdhcm5pbmcKICAgICAgbWF0Y2g6CiAgICAgICAgc2V2ZXJpdHk6IHdhcm5pbmcKICAgIC0gcmVjZWl2ZXI6IGxpbmUtd2F0Y2hkb2cKICAgICAgbWF0Y2g6CiAgICAgICAgYWxlcnRuYW1lOiBXYXRjaGRvZwo=
 type: Opaque
 EOF
Configuration content in plain-text
 global:
   resolve_timeout: 5m
   smtp_from: ocp@example.com
   smtp_smarthost: 'maildev.default.svc.cluster.local:25'
   smtp_hello: localhost
   smtp_require_tls: false
   slack_api_url: >-
     https://hooks.slack.com/services/T01BA5Z1QG3/B0XXXXXXXXXXXAeF
 inhibit_rules:
   - equal:
       - namespace
       - alertname
     source_match:
       severity: critical
     target_match_re:
       severity: warning|info
   - equal:
       - namespace
       - alertname
     source_match:
       severity: warning
     target_match_re:
       severity: info
 receivers:
   - name: Critical
     email_configs:
       - to: admin@example.com
   - name: Default
     email_configs:
       - to: admin@example.com
   - name: slack
     slack_configs:
       - channel: '#alert'
   - name: slack-warning
     slack_configs:
       - channel: '#alert'
   - name: slack-watchdog
     slack_configs:
       - channel: '#alert'
   - name: Warning
     email_configs:
       - to: warning@example.com
   - name: Watchdog
     email_configs:
       - to: watchdog@example.com
 route:
   group_by:
     - namespace
   group_interval: 5m
   group_wait: 30s
   receiver: Default
   repeat_interval: 1h
   routes:
     - receiver: Watchdog
       match:
         alertname: Watchdog
     - receiver: Critical
       match:
         severity: critical
     - receiver: Warning
       match:
         severity: warning
     - receiver: slack
       match:
         severity: info
     - receiver: slack-watchdog
       match:
         alertname: Watchdog
     - receiver: slack-warning
       match:
         severity: warning
     - receiver: line-warning
       match:
         severity: warning
     - receiver: line-watchdog
       match:
         alertname: Watchdog
Tesing Alerts
We will demontrate Alerts from Prometheus and AlertManager by using Platform and User Workload application with metrics from cpu, memory, persistent volume resource.
Procedures
Deploy a sample httpd pod with persistent volume 1G size mount to
/httpd-pvcpathoc new-project user1 cat << EOF | oc create -f - --- kind: Deployment apiVersion: apps/v1 metadata: name: httpd-24 namespace: user1 labels: app: httpd-24 app.kubernetes.io/component: httpd-24 app.kubernetes.io/instance: httpd-24 app.kubernetes.io/part-of: httpd-24-app app.openshift.io/runtime-namespace: user1 spec: replicas: 1 selector: matchLabels: app: httpd-24 template: metadata: labels: app: httpd-24 deploymentconfig: httpd-24 spec: volumes: - name: httpd-pvc persistentVolumeClaim: claimName: httpd-pvc containers: - name: httpd-24 image: registry.redhat.io/rhel8/httpd-24 ports: - containerPort: 8080 protocol: TCP - containerPort: 8443 protocol: TCP volumeMounts: - name: httpd-pvc mountPath: /httpd-pvc --- apiVersion: v1 kind: PersistentVolumeClaim metadata: name: httpd-pvc namespace: user1 spec: accessModes: - ReadWriteOnce resources: requests: storage: 1Gi storageClassName: thin volumeMode: Filesystem EOFrsh to httpd pod to check PV size and use
fallocatecommand to make PV high utilization (>95%)oc rsh $(oc -n user1 get pod | grep httpd | cut -d' ' -f1)check volume utilization
df -hresult,
/httpd-pvc, Use 1%Filesystem Size Used Avail Use% Mounted on overlay 120G 19G 102G 16% / tmpfs 64M 0 64M 0% /dev tmpfs 3.9G 0 3.9G 0% /sys/fs/cgroup shm 64M 0 64M 0% /dev/shm tmpfs 3.9G 47M 3.9G 2% /etc/passwd /dev/sdd 976M 2.6M 958M 1% /httpd-pvc /dev/mapper/coreos-luks-root-nocrypt 120G 19G 102G 16% /etc/hosts tmpfs 3.9G 28K 3.9G 1% /run/secrets/kubernetes.io/serviceaccount tmpfs 3.9G 0 3.9G 0% /proc/acpi tmpfs 3.9G 0 3.9G 0% /proc/scsi tmpfs 3.9G 0 3.9G 0% /sys/firmwareuse
fallocateto create a file with 950M sizecd /httpd-pvc/ fallocate -l 950M file.tmpre-check
/httpd-pvcagain, now it is Use 100%df -hresult
Filesystem                            Size  Used Avail Use% Mounted on
overlay                               120G   19G  102G  16% /
tmpfs                                  64M     0   64M   0% /dev
tmpfs                                 3.9G     0  3.9G   0% /sys/fs/cgroup
shm                                    64M     0   64M   0% /dev/shm
tmpfs                                 3.9G   47M  3.9G   2% /etc/passwd
/dev/sdd                              976M  953M  7.4M 100% /httpd-pvc
/dev/mapper/coreos-luks-root-nocrypt  120G   19G  102G  16% /etc/hosts
tmpfs                                 3.9G   28K  3.9G   1% /run/secrets/kubernetes.io/serviceaccount
tmpfs                                 3.9G     0  3.9G   0% /proc/acpi
tmpfs                                 3.9G     0  3.9G   0% /proc/scsi
tmpfs                                 3.9G     0  3.9G   0% /sys/firmware
For the User Workload Monitoring, we will need to add rolebinding to enabled permission to edit/view PrometheusRule, ServiceMonitor and PodMonitor.
Let's add
monitoring-editrole to userldapuseroc policy add-role-to-user monitoring-edit ldapuser -n user1Create Prometheus Rule to alert when PV utilization is >80% in namespace
user1cat << EOF | oc create -f - apiVersion: monitoring.coreos.com/v1 kind: PrometheusRule metadata: name: pvfull-alert namespace: user1 spec: groups: - name: PersistenVolumeFullAlertRule rules: - alert: PersistenVolumeFull expr: kubelet_volume_stats_available_bytes{job="kubelet",metrics_path="/metrics"} / kubelet_volume_stats_capacity_bytes{job="kubelet",metrics_path="/metrics"} < 0.20 for: 5m labels: secerity: critical annotations: message: The PersistentVolume claimed is under 20 percent free. EOFNow we can go back to OpenShift Console Developer View, go to
user1project > Monitoring > Alerts- We will see our user defined alert rule and alert that trigger
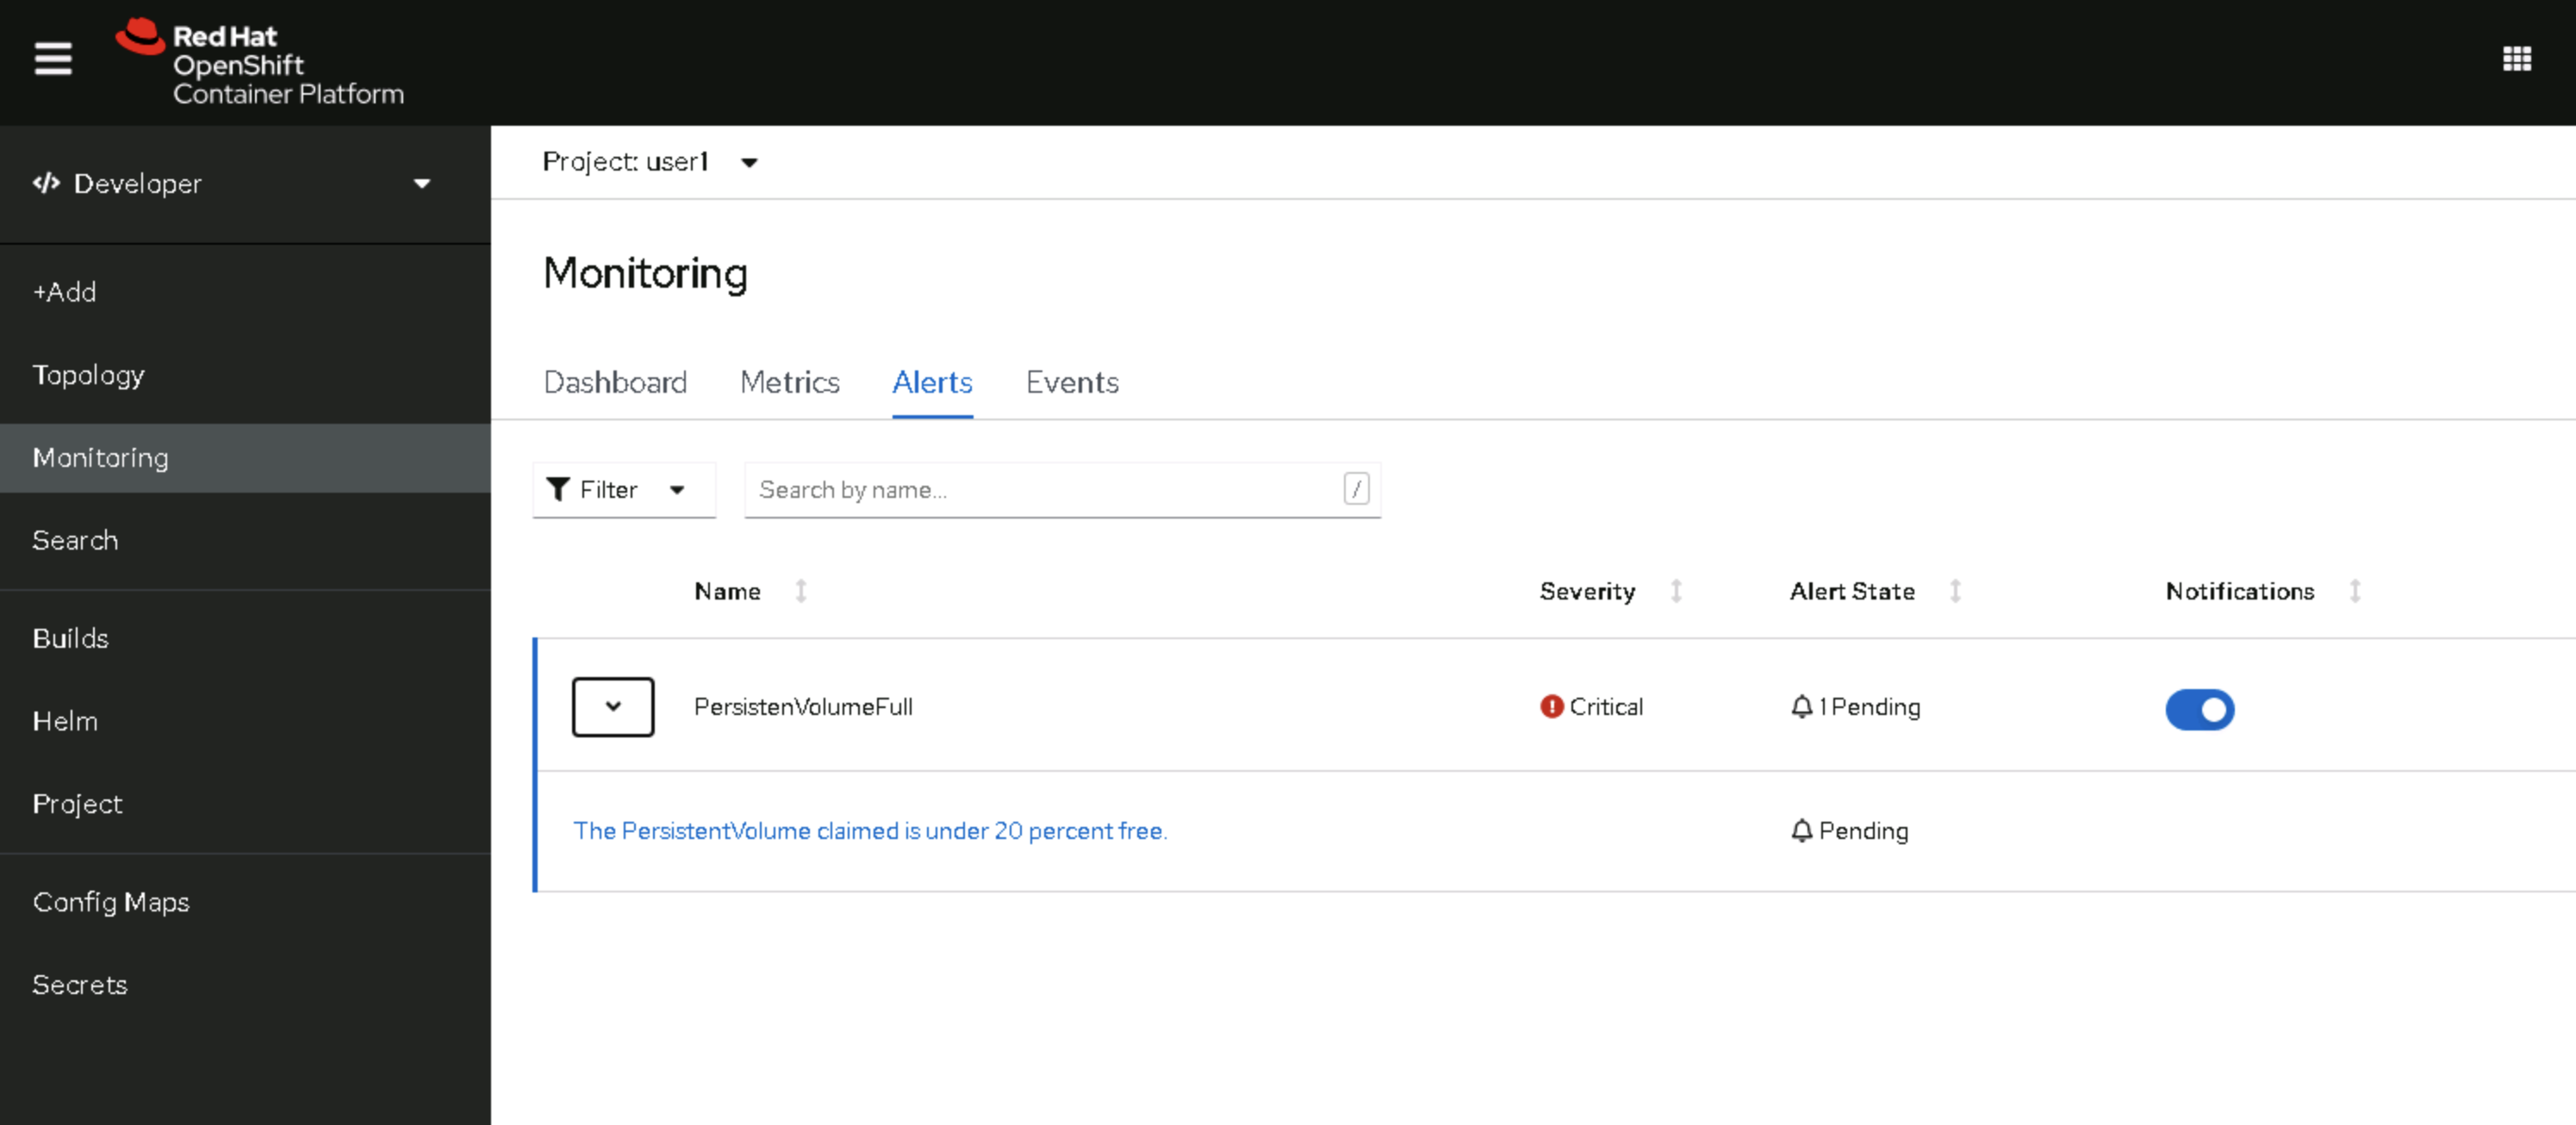
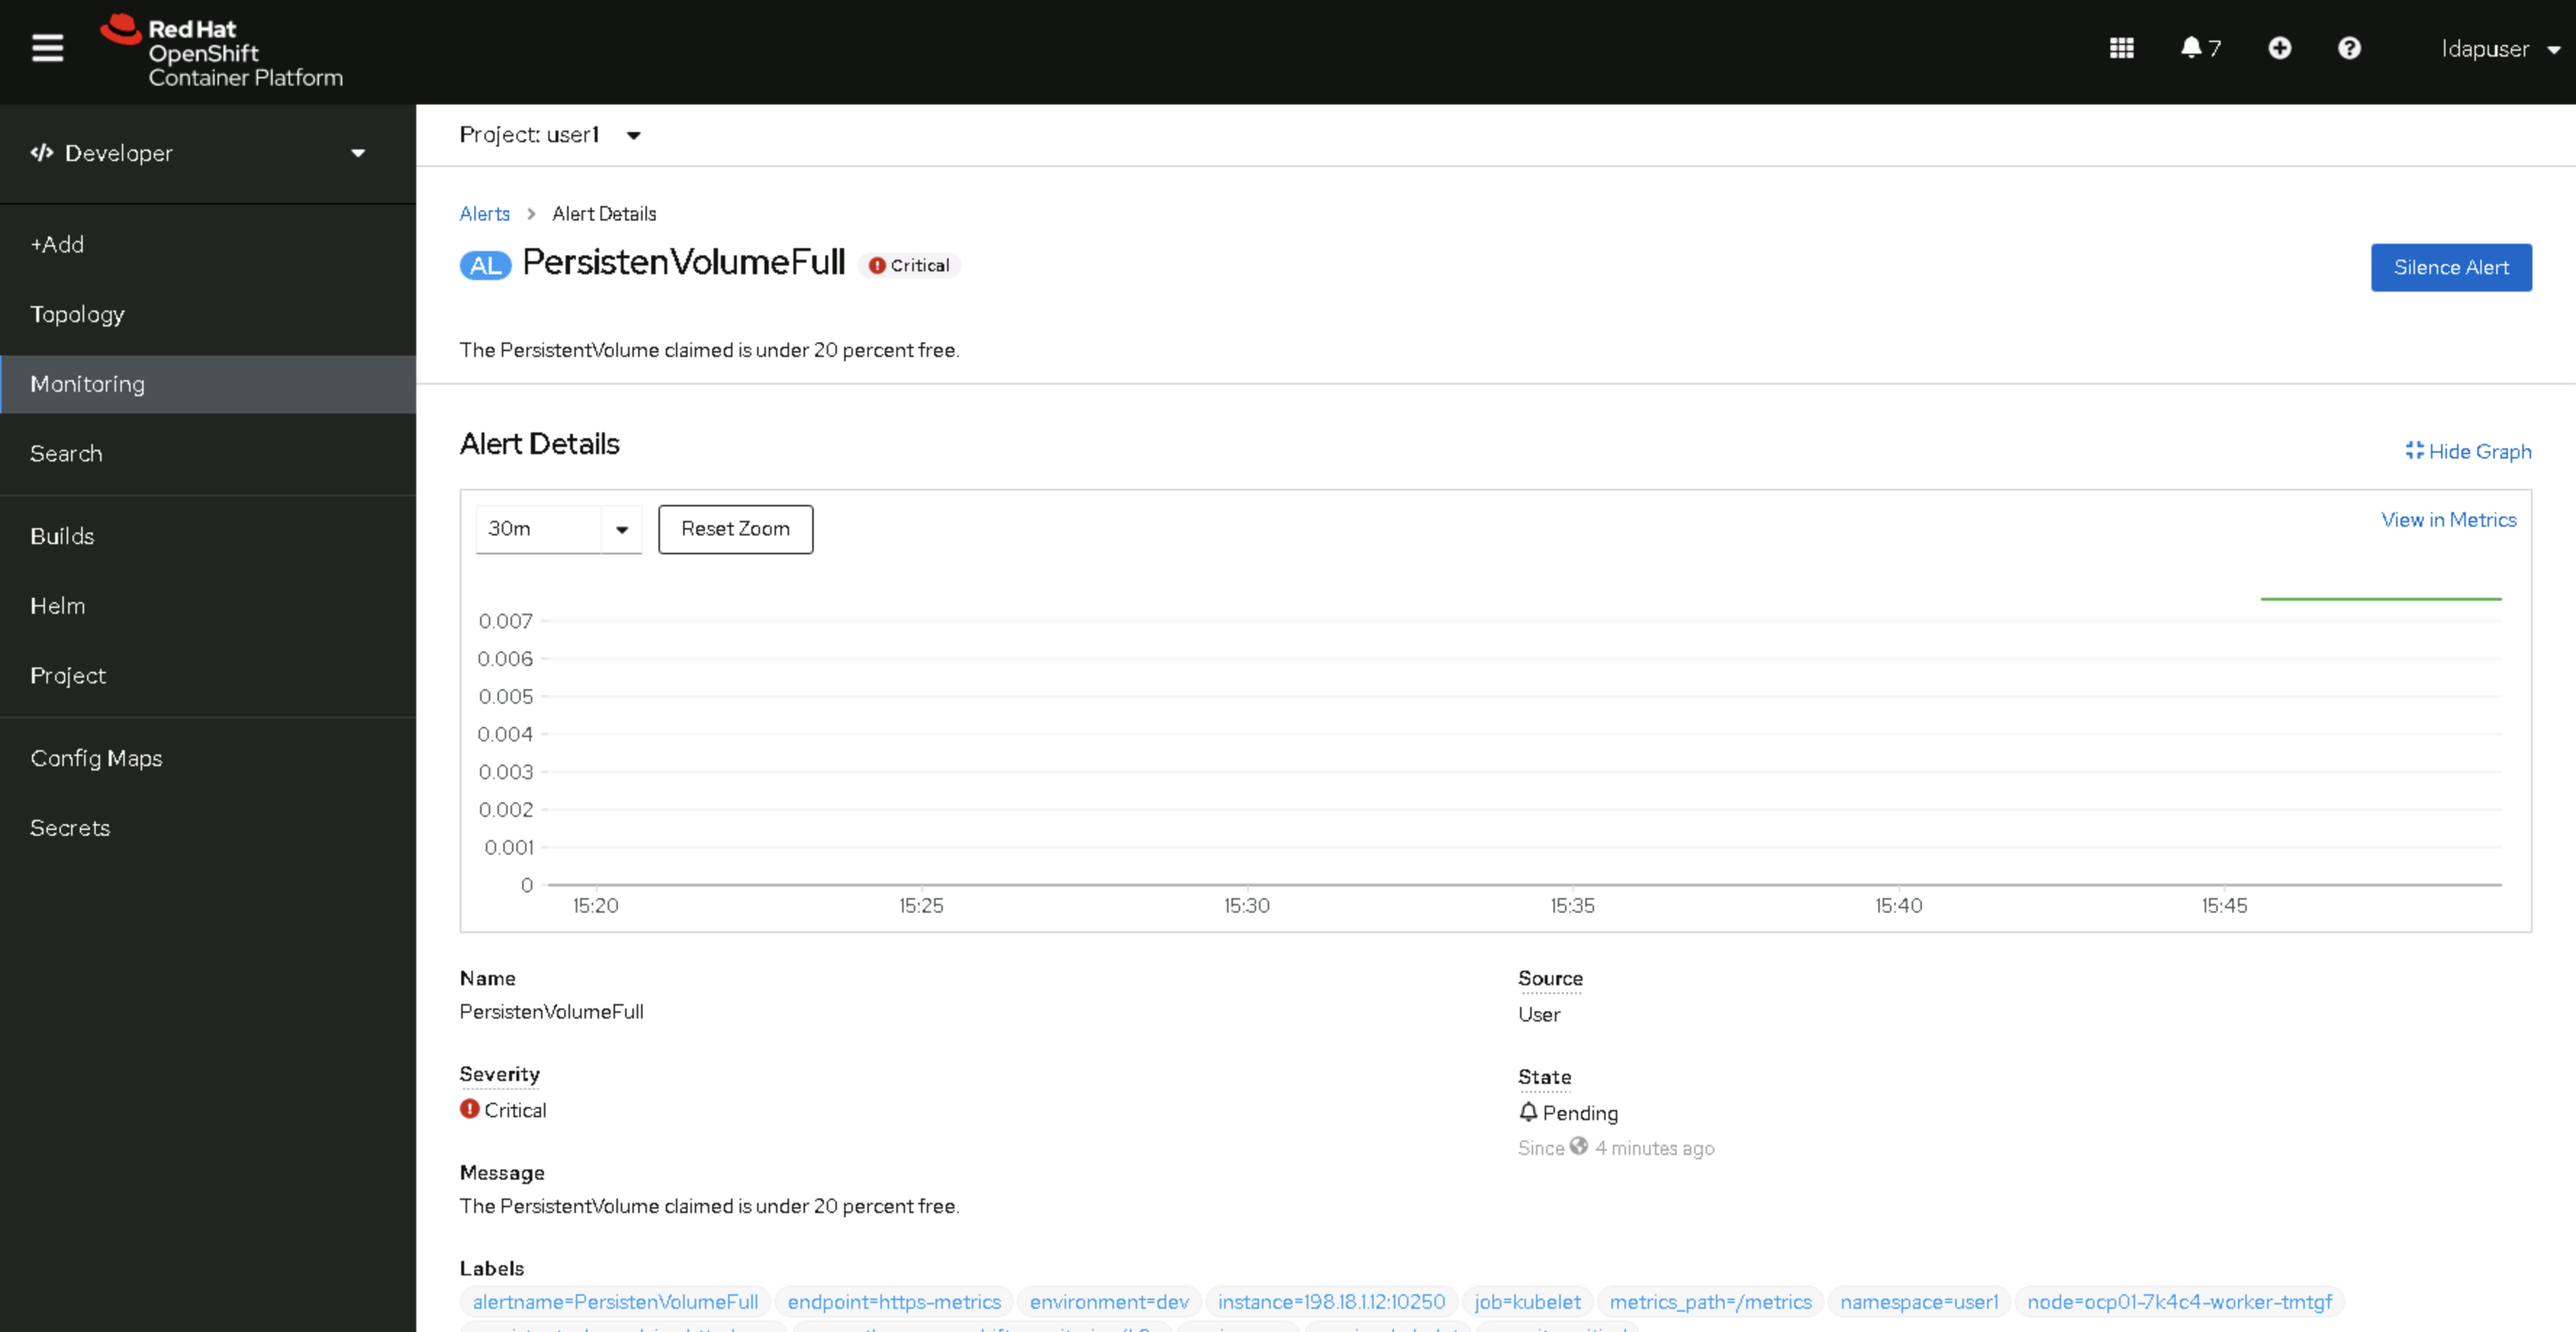
- You can click on Alert and see the details
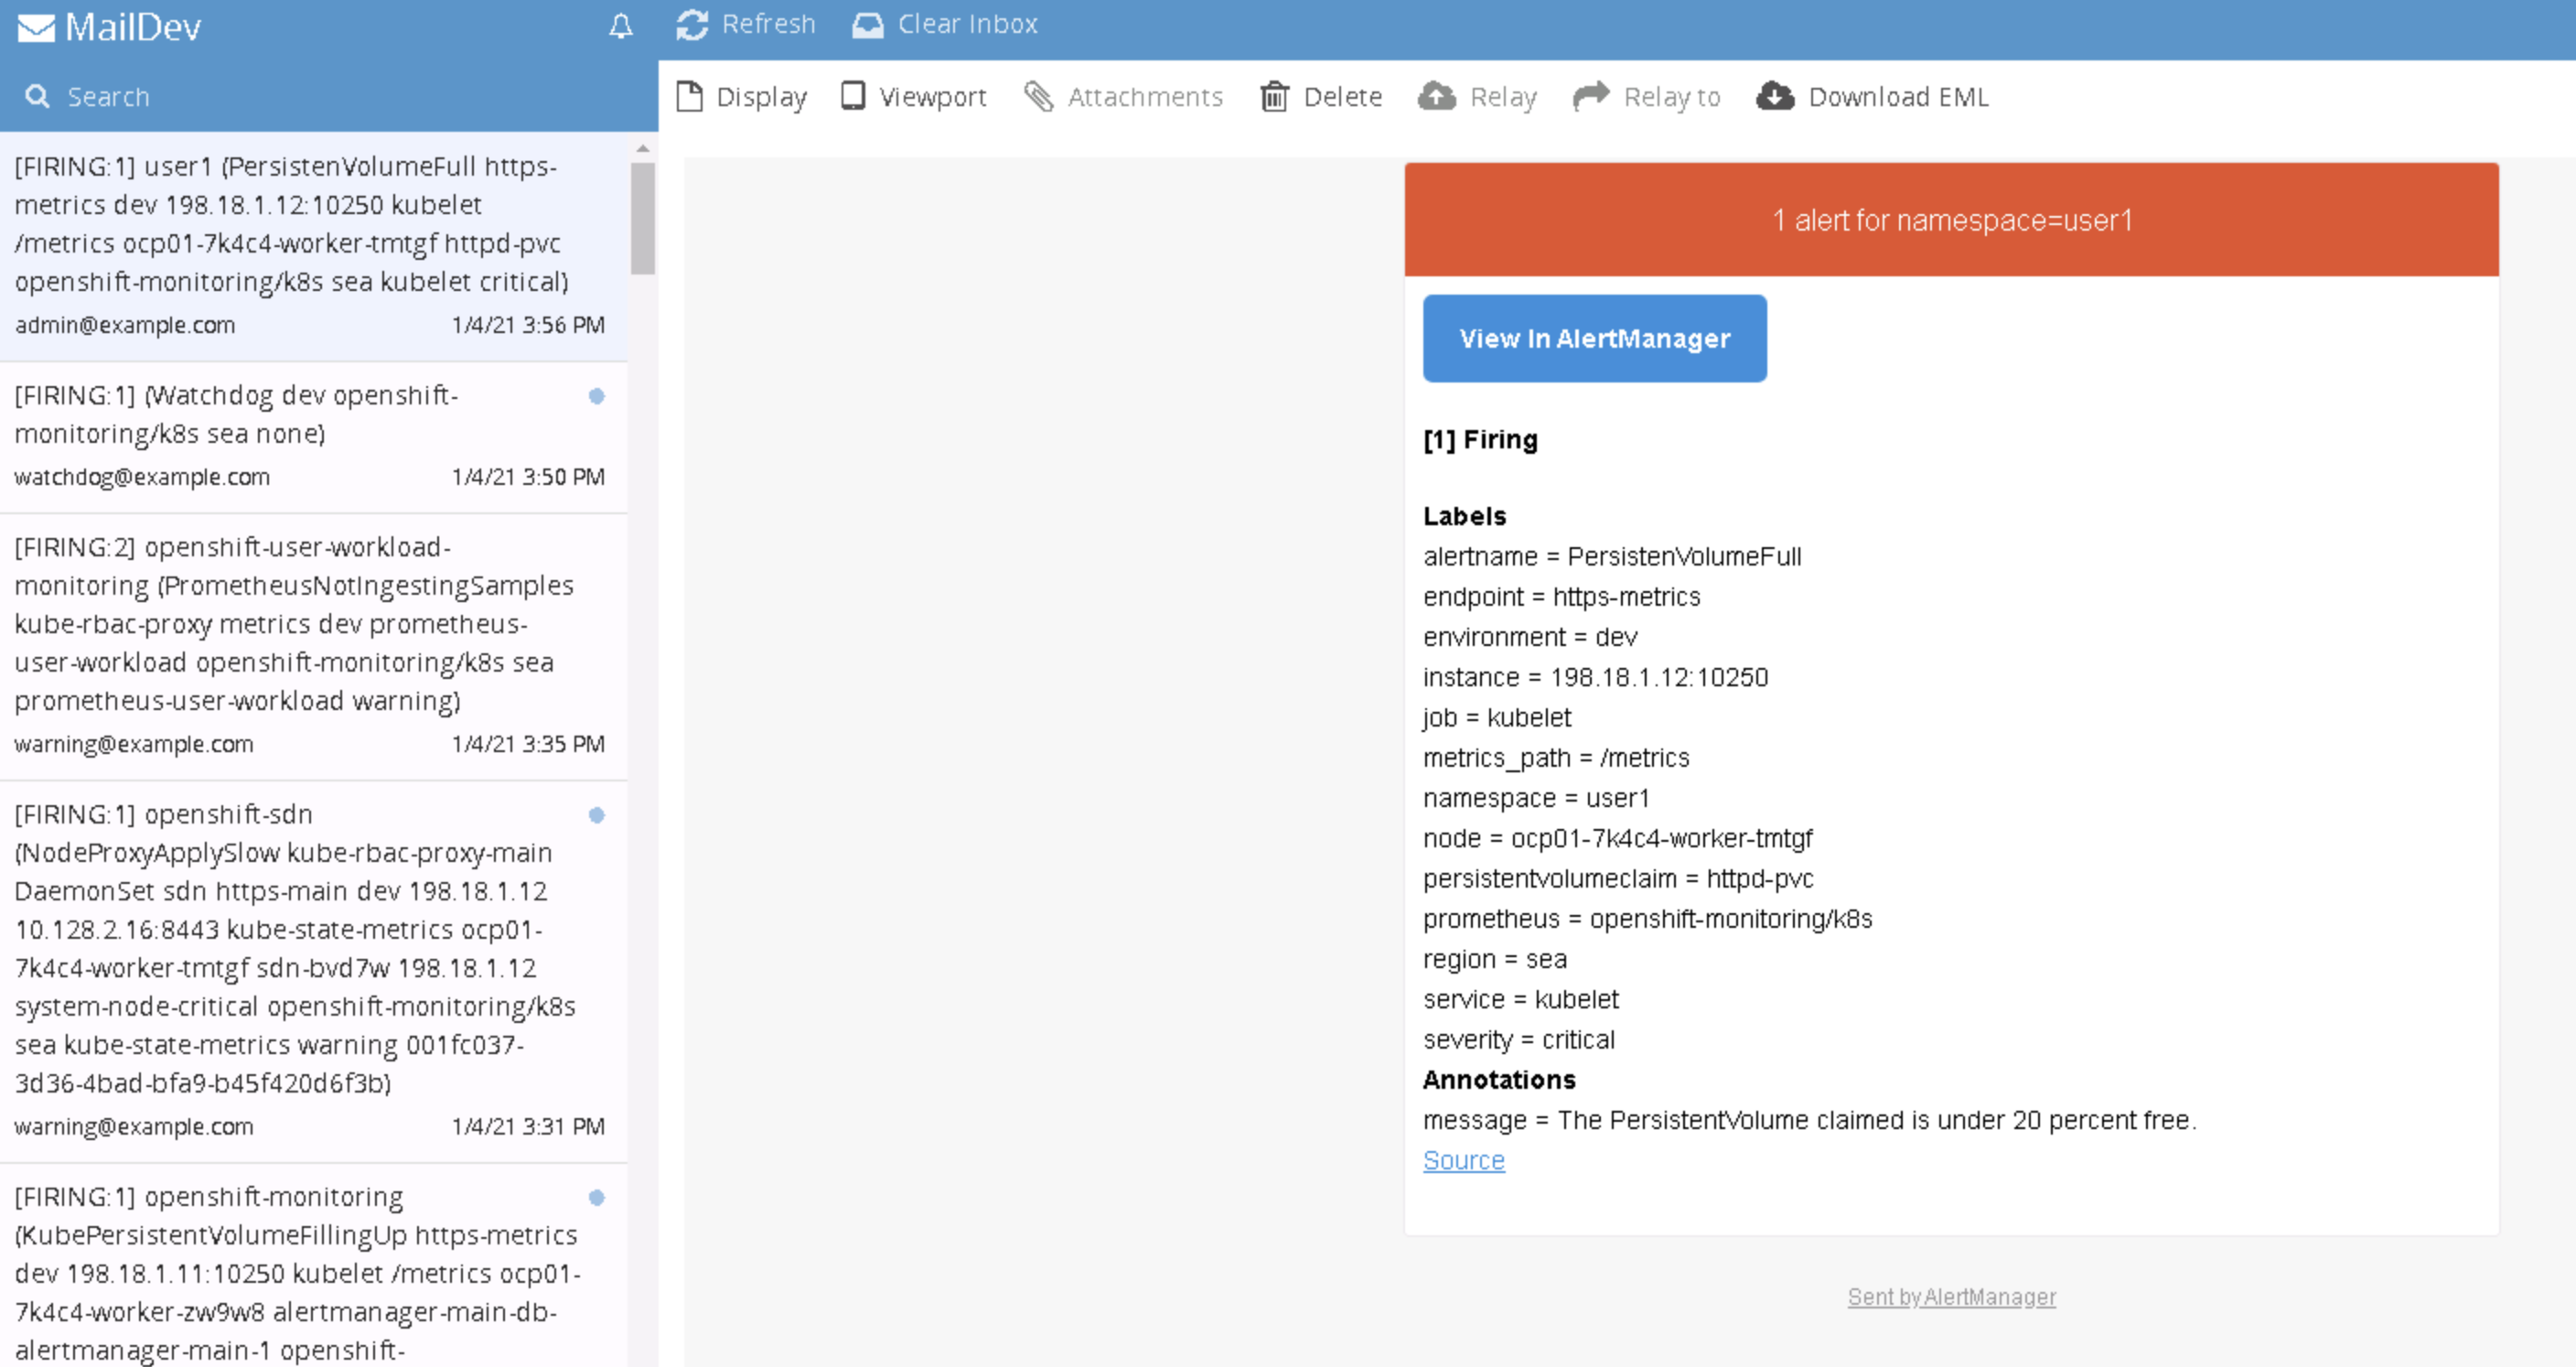
- When alert is Firing, firing alerts will also route to external notifications defined by AlertManager