User Workload Monitoring
Prerequisites
Setup User Workload Monitoring
  DEFAULT_STORAGE_CLASS=$(oc get sc -A -o jsonpath='{.items[?(@.metadata.annotations.storageclass\.kubernetes\.io/is-default-class=="true")].metadata.name}')
  cat manifests/cluster-monitoring-config.yaml | sed 's/storageClassName:.*/storageClassName: '$DEFAULT_STORAGE_CLASS'/' | oc apply -f  -
  sleep 10
  oc -n openshift-user-workload-monitoring wait --for condition=ready \
   --timeout=180s pod -l app.kubernetes.io/name=prometheus
  oc -n openshift-user-workload-monitoring wait --for condition=ready \
   --timeout=180s pod -l app.kubernetes.io/name=thanos-ruler
  oc get pvc -n openshift-monitoring
Output
  configmap/cluster-monitoring-config created
  pod/prometheus-user-workload-0 condition met
  pod/prometheus-user-workload-1 condition met
  pod/thanos-ruler-user-workload-0 condition met
  pod/thanos-ruler-user-workload-1 condition met
  NAME                                 STATUS   VOLUME                                     CAPACITY   ACCESS MODES   STORAGECLASS                           AGE
  prometheus-k8s-db-prometheus-k8s-0   Bound    pvc-c1513ebb-6fcf-4136-b3a2-41a7a3afd83b   50Gi       RWO            ocs-external-storagecluster-ceph-rbd   21s
  prometheus-k8s-db-prometheus-k8s-1   Bound    pvc-f9f9d7b1-3303-41ed-9549-43fab596cebe   50Gi       RWO            ocs-external-storagecluster-ceph-rbd   21s
Verify monitoring stack
oc get pod -n openshift-user-workload-monitoringSample output
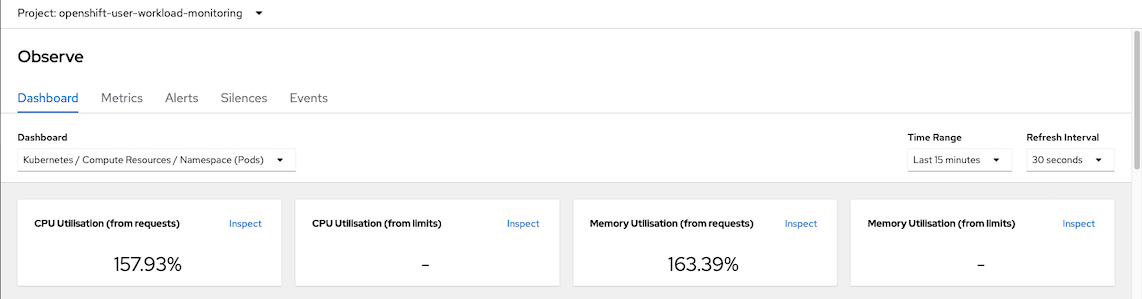
NAME                                   READY   STATUS    RESTARTS   AGE
prometheus-operator-787b6f6d75-lrgjg   2/2     Running   0          70s
prometheus-user-workload-0             6/6     Running   0          63s
prometheus-user-workload-1             6/6     Running   0          63s
thanos-ruler-user-workload-0           4/4     Running   0          62s
thanos-ruler-user-workload-1           4/4     Running   0          62s
CPU and Memory used by User Workload Monitoring
Overall resouces consumed by user workload monitoring
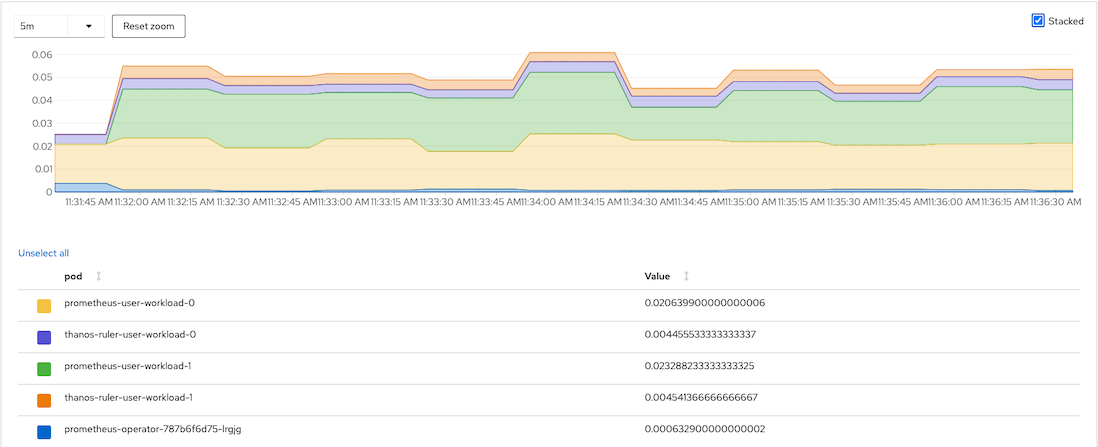
CPU Usage
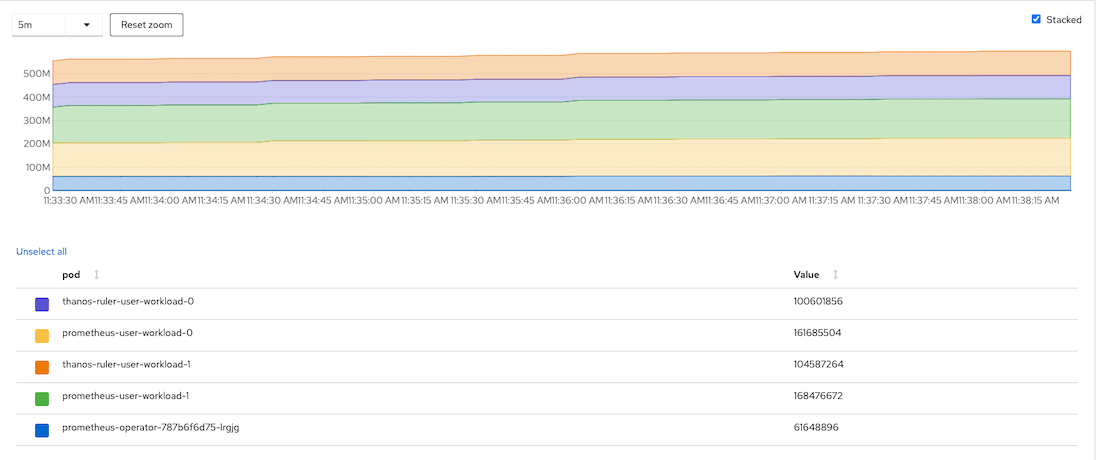
Memory Usage
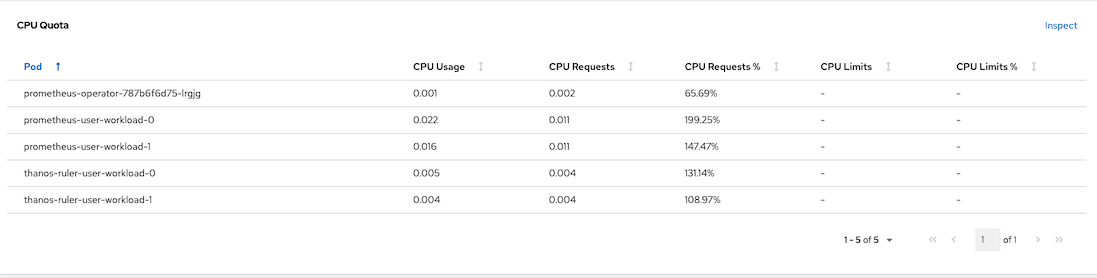
CPU Quota
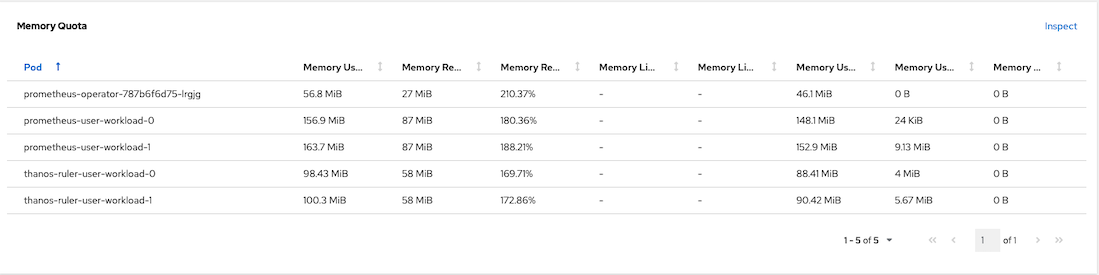
Memory Quota
Service Monitoring
Deploy frontend/backend app with custom metrics
oc create -f manifests/frontend-v1-and-backend-v1-JVM.yaml -n project1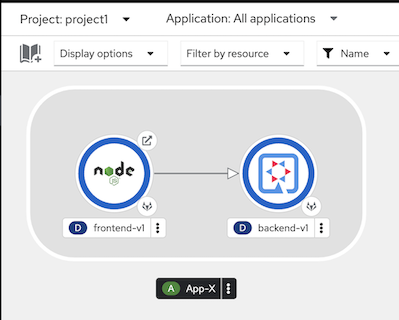
Call frontend app with curl
curl https://$(oc get route frontend -o jsonpath='{.spec.host}' -n project1)Output
Frontend version: v1 => [Backend: http://backend:8080, Response: 200, Body: Backend version:v1, Response:200, Host:backend-v1-5587465b8d-9kvsc, Status:200, Message: Hello, World]Check for backend's metrics
Check JVM heap size
oc exec -n project1 $(oc get pods -l app=backend \
--no-headers  -o custom-columns='Name:.metadata.name' \
-n project1 | head -n 1 ) \
-- curl -s  http://localhost:8080/q/metrics | grep heap
Sample output
jvm_memory_used_bytes{area="heap",id="Tenured Gen"} 1.1301808E7
jvm_memory_used_bytes{area="nonheap",id="CodeHeap 'profiled nmethods'"} 5261952.0
jvm_memory_used_bytes{area="heap",id="Eden Space"} 2506768.0
jvm_memory_used_bytes{area="nonheap",id="Metaspace"} 3.3255E7
jvm_memory_used_bytes{area="nonheap",id="CodeHeap 'non-nmethods'"} 1389824.0
jvm_memory_used_bytes{area="heap",id="Survivor Space"} 524288.0
jvm_memory_used_bytes{area="nonheap",id="Compressed Class Space"} 4096808.0
jvm_memory_used_bytes{area="nonheap",id="CodeHeap 'non-profiled nmethods'"} 1120640.0
...
Check for backend application related metrics
curl https://$(oc get route frontend -n project1 -o jsonpath='{.spec.host}')
oc exec -n project1 $(oc get pods -l app=backend \
--no-headers  -o custom-columns='Name:.metadata.name' \
-n project1 | head -n 1 ) \
-- curl -s  http://localhost:8080/q/metrics | grep http_server_requests_seconds
Check that http_server_requests_seconds_count with method GET and root URI value is 1 with return status 200
# HELP http_server_requests_seconds
http_server_requests_seconds_count{method="GET",outcome="SUCCESS",status="200",uri="root"} 2.0
http_server_requests_seconds_sum{method="GET",outcome="SUCCESS",status="200",uri="root"} 3.769968656
# TYPE http_server_requests_seconds_max gauge
# HELP http_server_requests_seconds_max
http_server_requests_seconds_max{method="GET",outcome="SUCCESS",status="200",uri="root"} 3.486753482
Create Service Monitoring to monitor backend service
  apiVersion: monitoring.coreos.com/v1
  kind: ServiceMonitor
  metadata:
    name: backend-monitor
  spec:
    endpoints:
    - interval: 30s
      port: http
      path: /q/metrics # Get metrics from URI /q/metrics
      scheme: http
    selector:
      matchLabels:
        app: backend # select only label app = backend
Create service monitor
oc apply -f manifests/backend-service-monitor.yaml -n project1Remark: Role monitor-edit is required for create ServiceMonitor and PodMonitor resources. Following example is granting role montior-edit to user1 for project1
oc adm policy add-role-to-user monitoring-edit user1 -n project1Developer Console monitoring metrics
Select application metrics
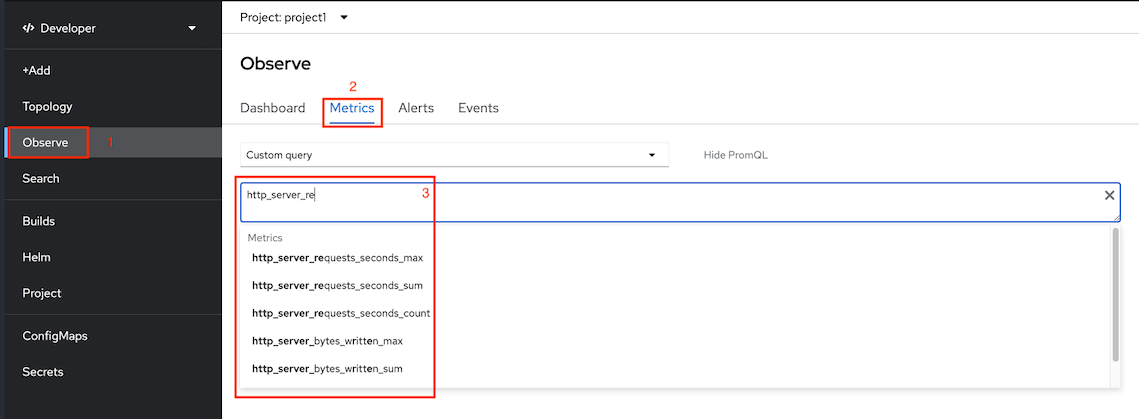
Application metrics
Scale backend-v1 and frontend-v1 to 5 pod and run load test tool
oc scale deployment backend-v1 --replicas=5 -n project1 oc scale deployment frontend-v1 --replicas=5 -n project1- Use K6
oc run load-test-frontend -n project1 \ -i --image=loadimpact/k6 \ --rm=true --restart=Never -- run -< manifests/load-test-k6.js \ -e URL=http://frontend:8080 \ -e THREADS=10 \ -e RAMPUP=30s \ -e DURATION=3m \ -e RAMPDOWN=30s \ -e K6_NO_CONNECTION_REUSE=true- Use Siege
oc create -f manifests/tools.yaml -n project1
TOOL=$(oc get po -n project1 -l app=network-tools --no-headers  -o custom-columns='Name:.metadata.name')
Run siege command
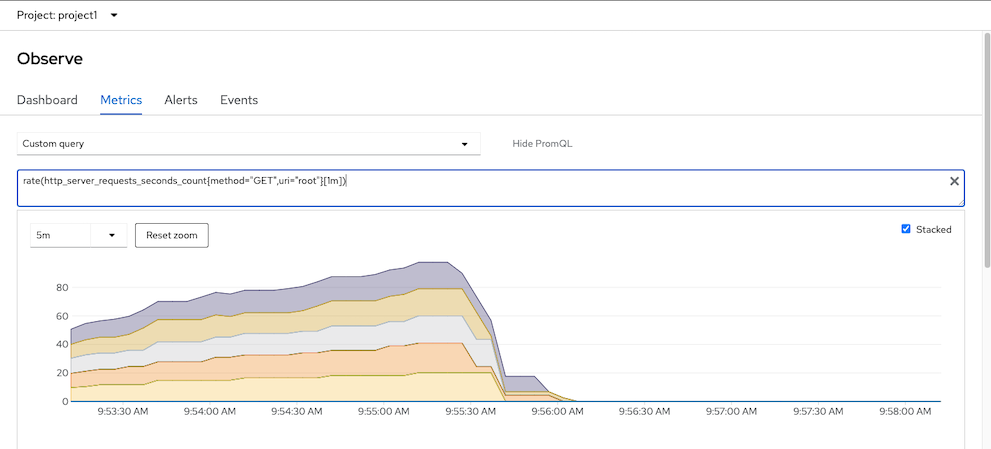
oc exec -n project1 $TOOL -- siege -c 20 -t 4m http://frontend:8080PromQL for query request/sec for GET method to root URI of backend service
rate(http_server_requests_seconds_count{method="GET",uri="root"}[1m])Sample stacked graph
K6
This is optional steps. If you have k6 on your manchine
k6 run manifests/load-test-k6.js \
--out json=output.json \
--summary-export=summary-export.json \
-e URL=https://$(oc get route frontend -o jsonpath='{.spec.host}' -n project1) \
-e THREADS=10 \
-e RAMPUP=30s \
-e DURATION=3m \
-e RAMPDOWN=30s \
-e K6_NO_CONNECTION_REUSE=true
Remark: output are stored in output.json and summary-export.json
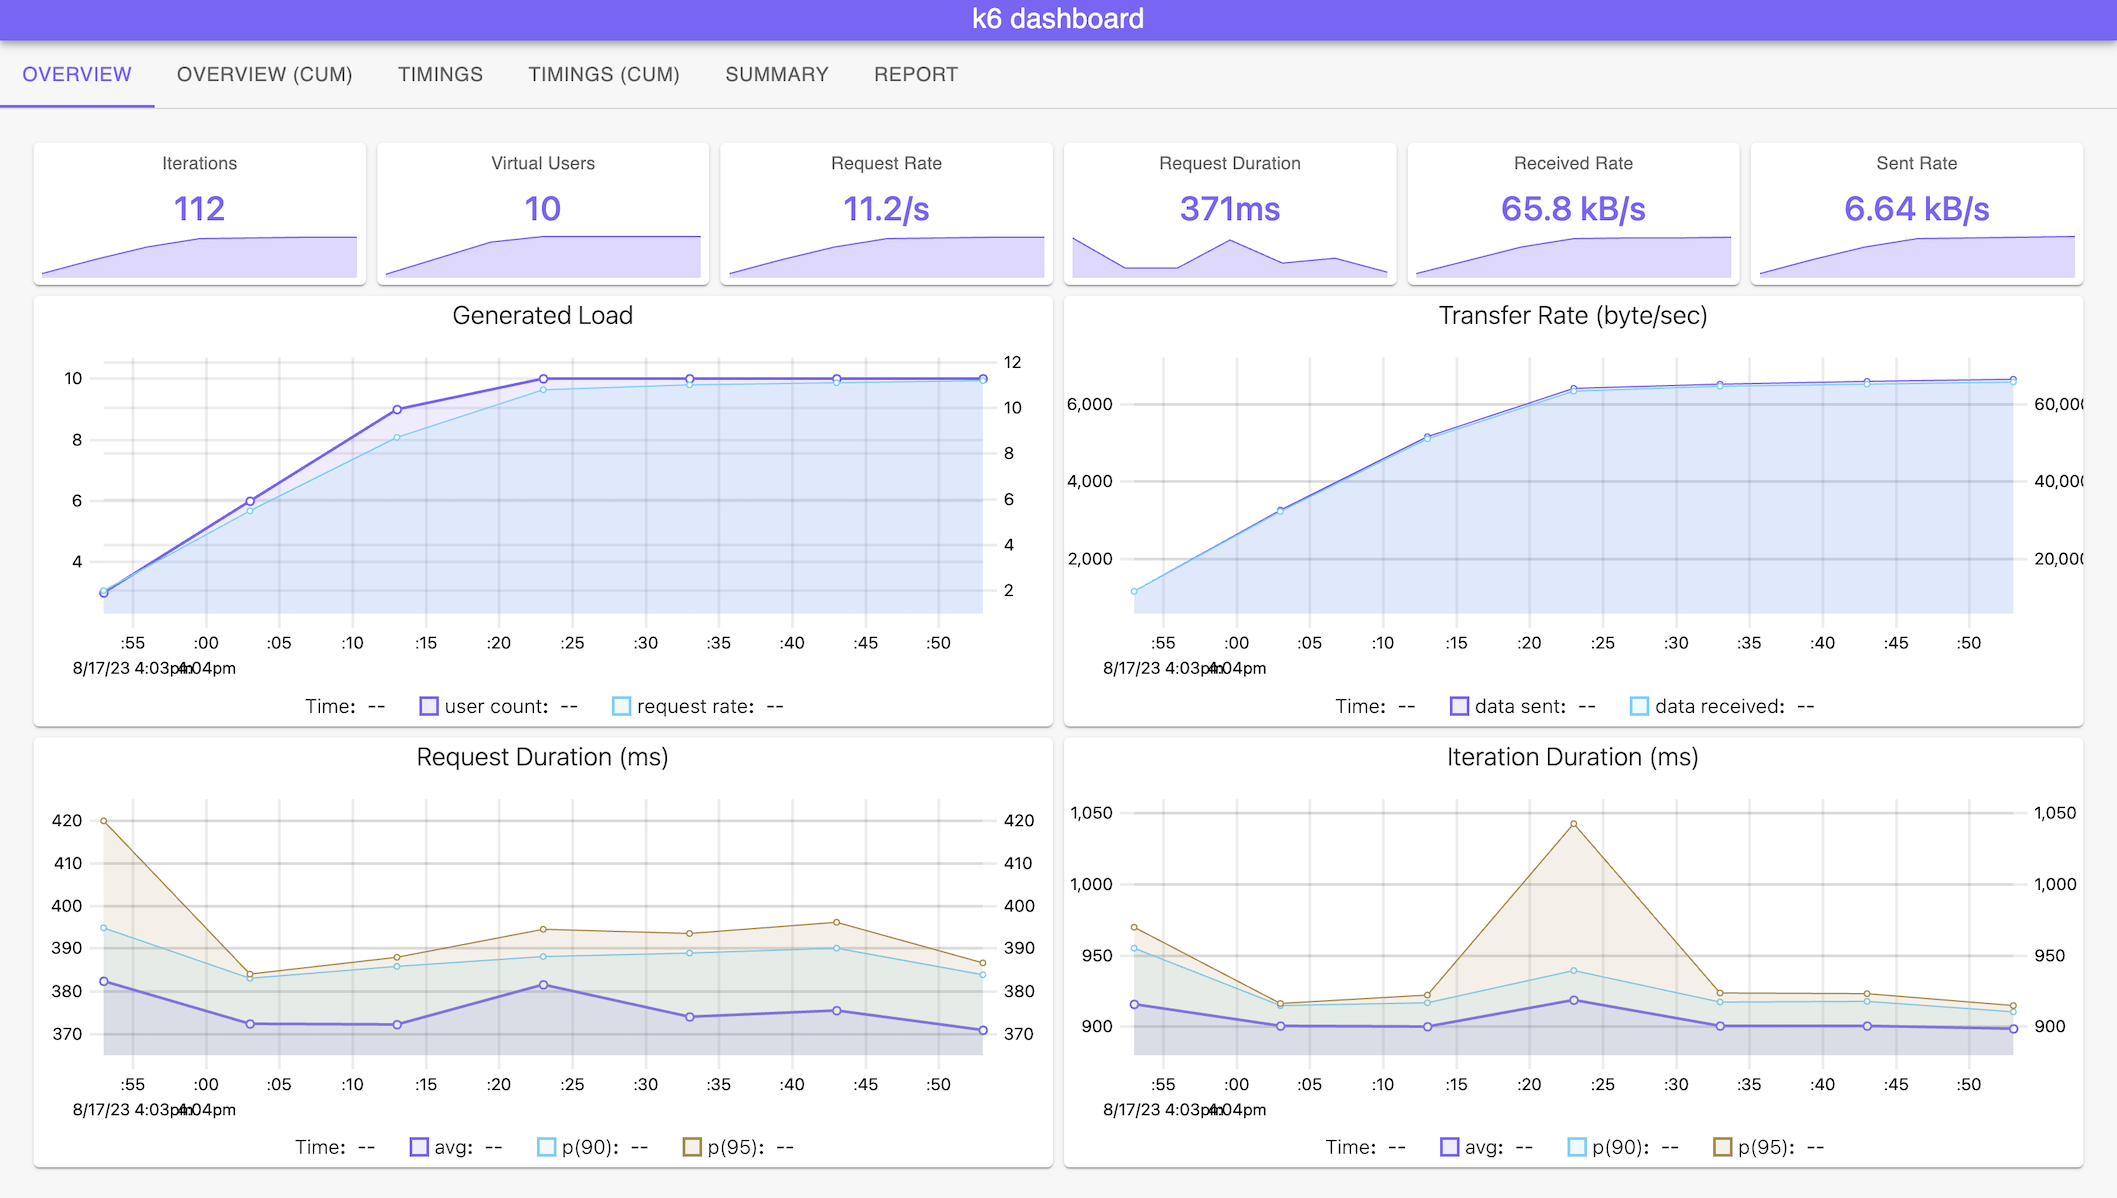
Run K6 with dashboard (You need to install K6 dashbaord first)
k6 run manifests/load-test-k6.js \
--out dashboard \
-e URL=https://$(oc get route frontend -o jsonpath='{.spec.host}' -n project1) \
-e THREADS=10 \
-e RAMPUP=30s \
-e DURATION=3m \
-e RAMPDOWN=30s \
-e K6_NO_CONNECTION_REUSE=true
View Dashboard
Custom Grafana Dashboard
Install Grafana Operator to project application-monitor
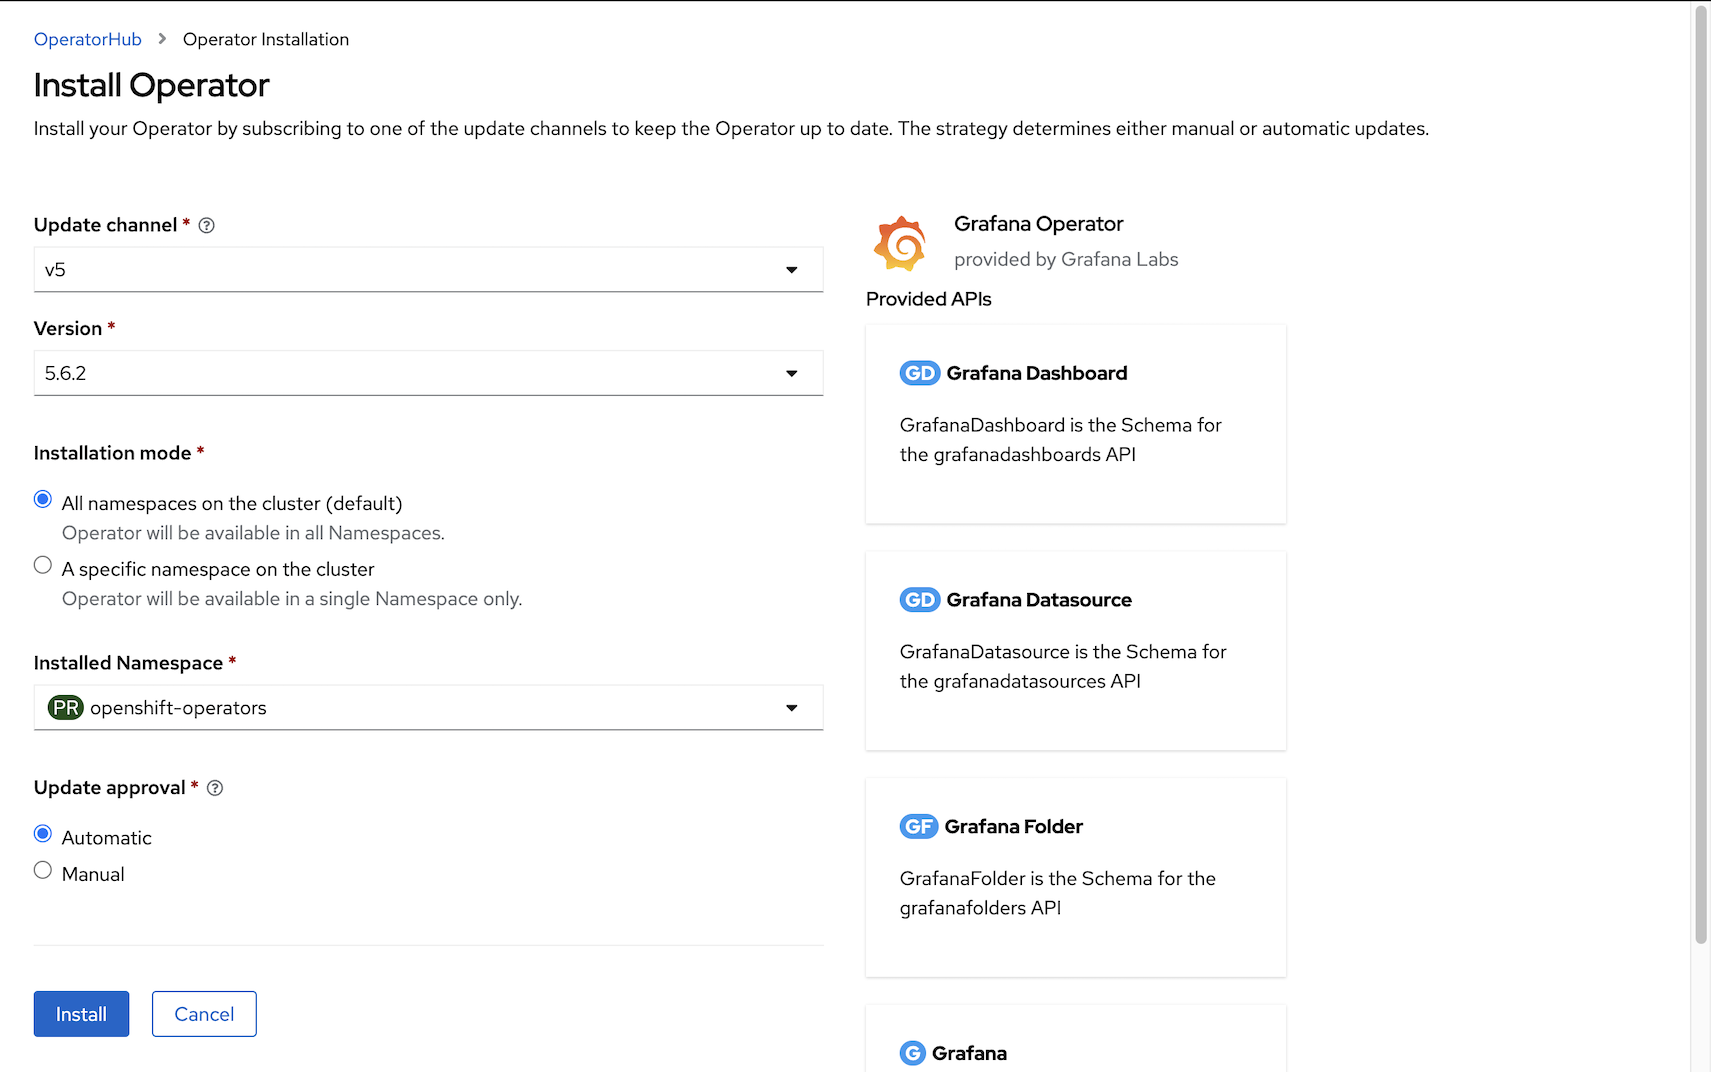
or using CLI
oc create -f manifests/grafana-sub.yamlVerify
oc get csv -n openshift-operatorsOutput
NAME                      DISPLAY            VERSION   REPLACES                  PHASE
grafana-operator.v5.6.2   Grafana Operator   5.6.2     grafana-operator.v5.6.1   Succeeded
Use Grafana Operator by Red Hat to deploy Grafana and configure datasource to Thanos Querier Remark: Grafana Operator is Community Edition - not supported by Red Hat
Create project
oc new-project application-monitor --display-name="App Dashboard" --description="Grafana Dashboard for Application Monitoring"
Create Grafana instance
oc create -f manifests/grafana.yaml -n application-monitor
oc create route edge grafana --service=grafana-service --port=3000 -n application-monitor
watch -d oc get pods -n application-monitor
Sample Output
NAME                                 READY   STATUS    RESTARTS   AGE
grafana-deployment-96d5f5954-5hml7   1/1     Running   0          14s
Add cluster role
cluster-monitoring-viewto Grafana ServiceAccountoc adm policy add-cluster-role-to-user cluster-monitoring-view \ -z grafana-sa -n application-monitorCreate Grafana DataSource with serviceaccount grafana-serviceaccount's token and connect to thanos-querier
TOKEN=$(oc create token grafana-sa --duration=4294967296s -n application-monitor)
cat manifests/grafana-datasource.yaml|sed 's/Bearer .*/Bearer '"$TOKEN""'"'/'|oc apply -n application-monitor -f -
Create Grafana Dashboard
oc apply -f manifests/grafana-dashboard.yaml -n application-monitorLogin to Grafana Dashboard with following URL
echo "Grafana URL => https://$(oc get route grafana -o jsonpath='{.spec.host}' -n application-monitor)"or use link provided by Developer Console
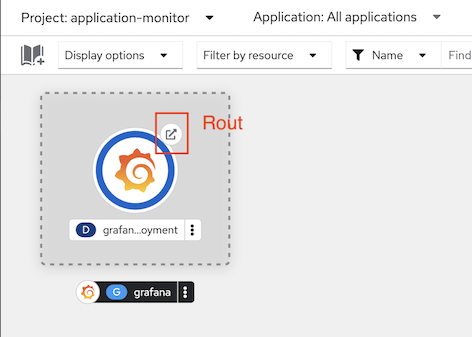
Login with user
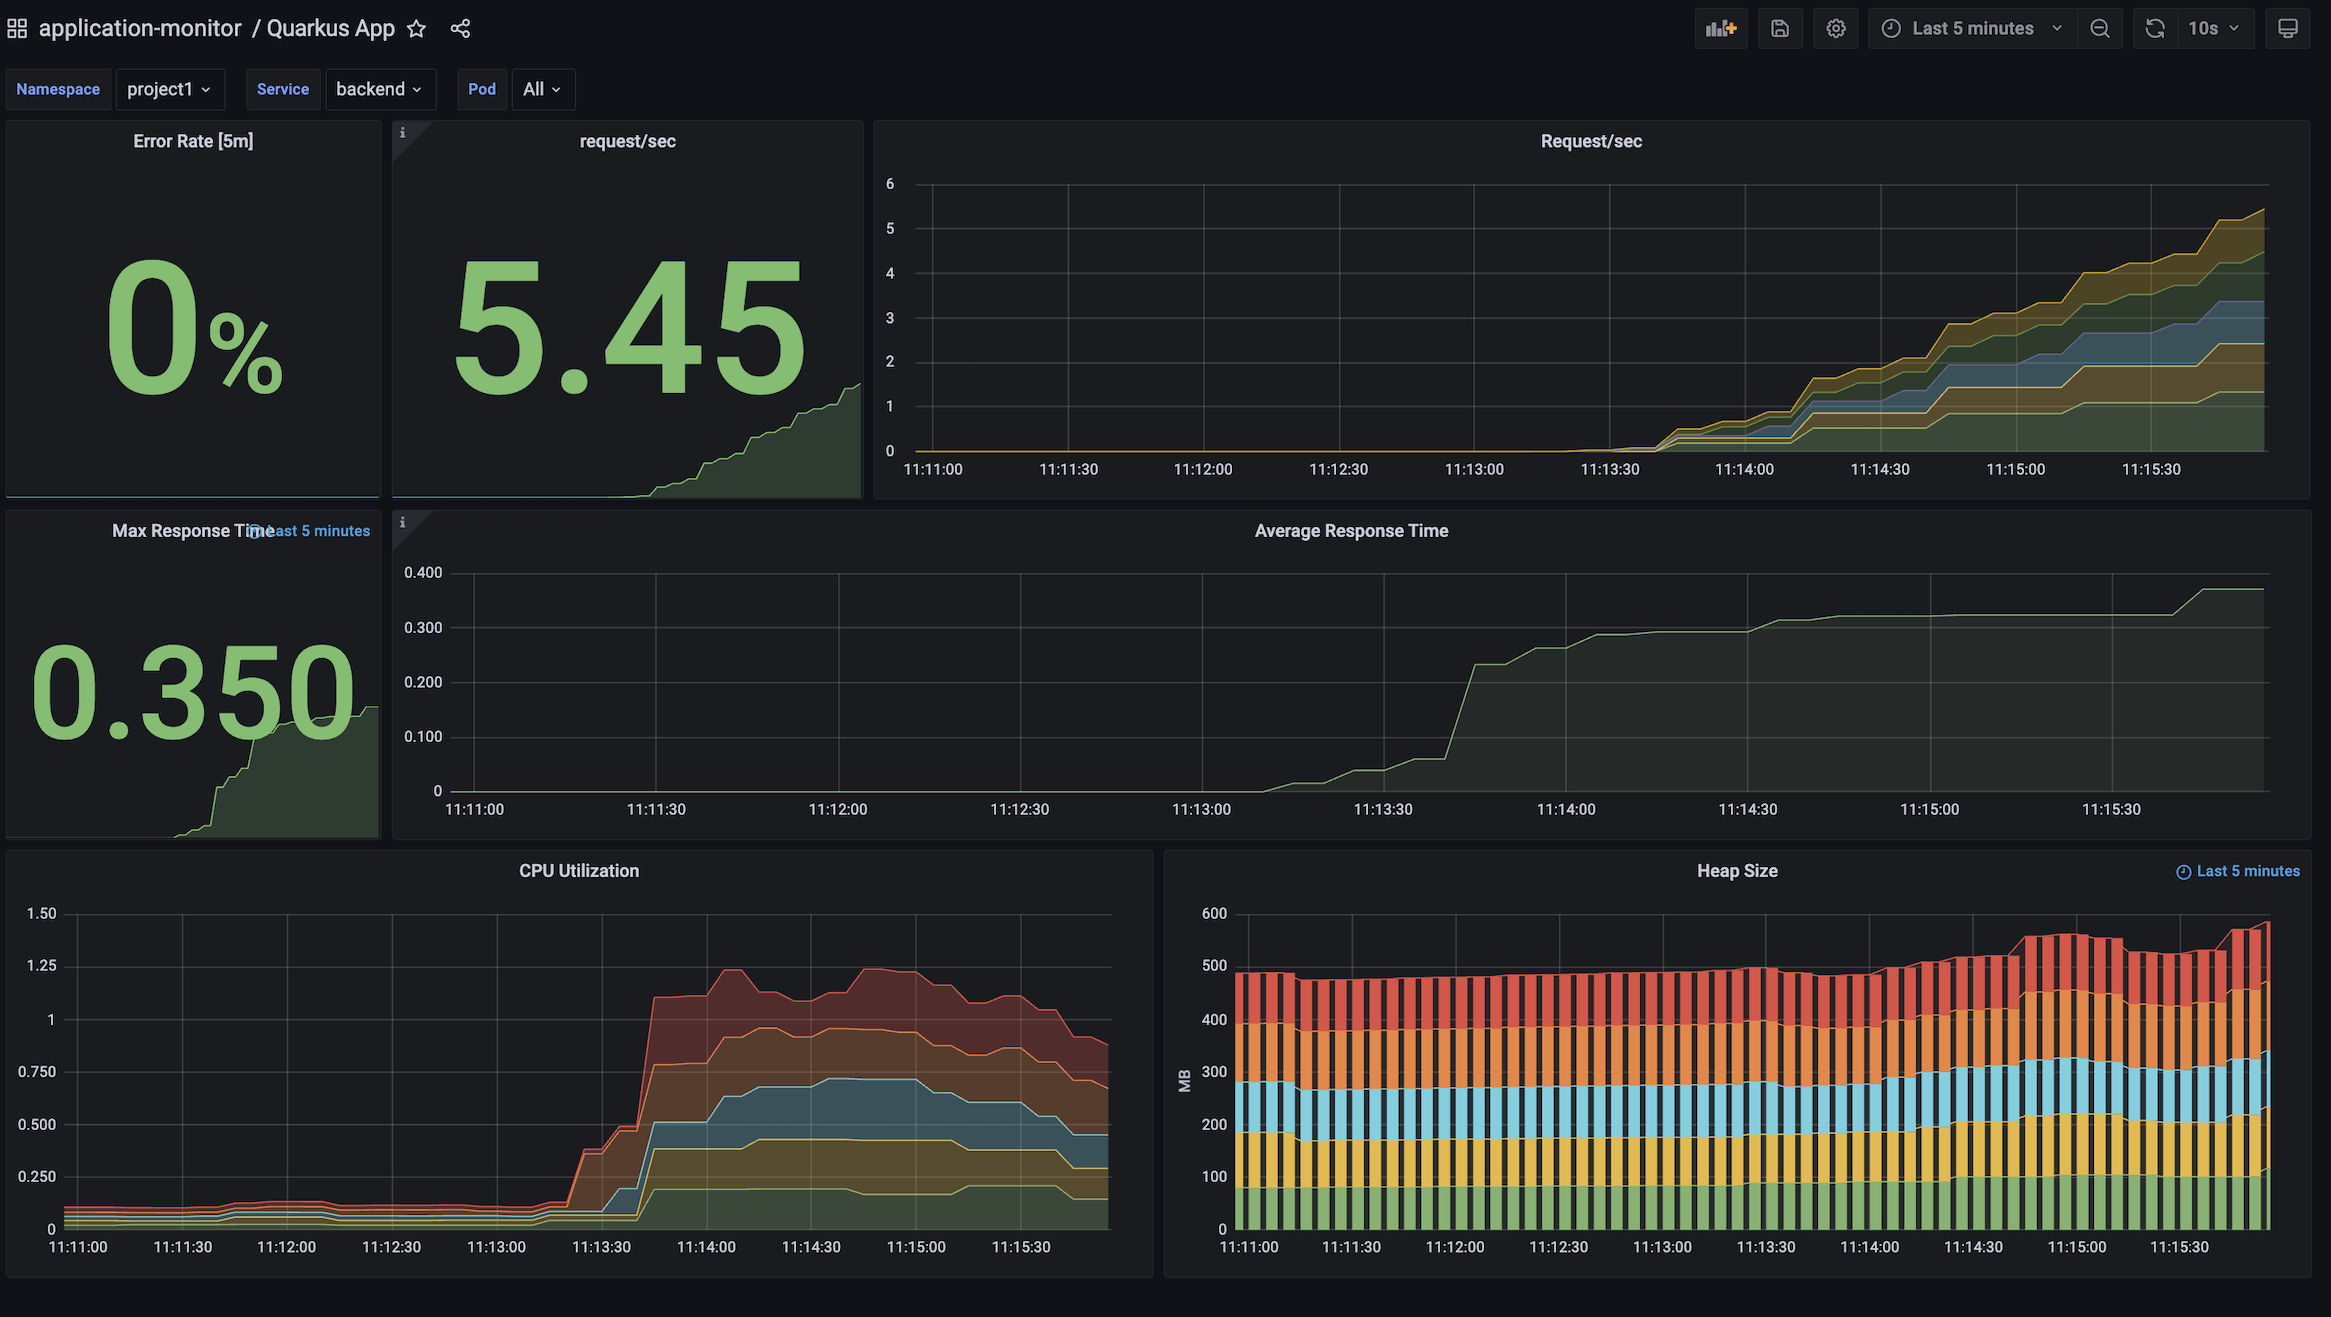
adminand passwordopenshiftGenerate workload
bash script to loop request to frontend application.
FRONTEND_URL=https://$(oc get route frontend -n project1 -o jsonpath='{.spec.host}')
while [ 1 ];
do
  curl $FRONTEND_URL
  printf "\n"
  sleep .2
done
k6 load test tool with 10 threads for 5 minutes
oc run load-test-frontend -n project1 \
-i --image=loadimpact/k6  \
--rm=true --restart=Never --  run -< manifests/load-test-k6.js \
-e URL=http://frontend:8080 \
-e THREADS=15 \
-e RAMPUP=30s \
-e DURATION=5m \
-e RAMPDOWN=30s
Grafana Dashboard
Custom Alert
Check PrometheusRule
backend-app-alert is consists with 2 following alerts:
ConcurrentBackend severity warning when total concurrent reqeusts is greater than 40 requests/sec
HighLatency servierity critical when percentile 90th of response time is greater than 5 sec
Create backend-app-alert
oc apply -f manifests/backend-custom-alert.yamlRemark: Role
monitoring-rules-viewis required for viewPrometheusRuleresource and rolemonitoring-rules-editis required to create, modify, and deletingPrometheusRuleFollowing example is granting role monitoring-rules-view and monitoring-rules-edit to user1 for project1
oc adm policy add-role-to-user  monitoring-rules-view user1 -n project1
oc adm policy add-role-to-user  monitoring-rules-edit user1 -n project1
Test
ConcurrentBackendalert with 25 concurrent requestsoc run load-test-frontend -n project1 \ -i --image=loadimpact/k6 \ --rm=true --restart=Never -- run -< manifests/load-test-k6.js \ -e URL=http://frontend:8080 \ -e THREADS=15 \ -e RAMPUP=30s \ -e DURATION=5m \ -e RAMPDOWN=30sCheck for alert in Developer Console by select Menu
Monitoringthen selectAlerts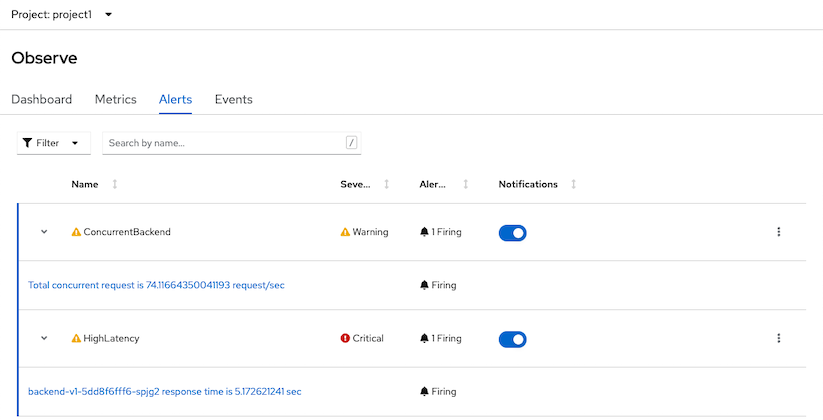
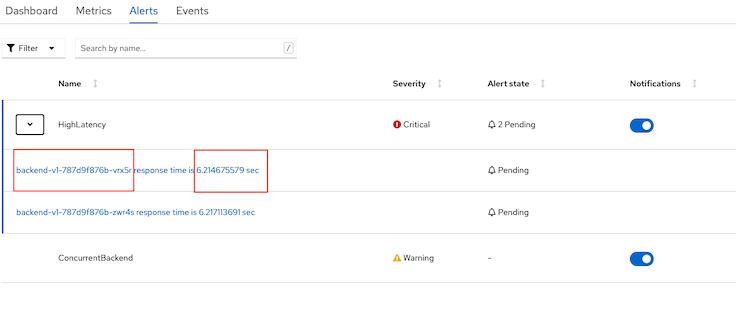
Check for alert in Developer Console
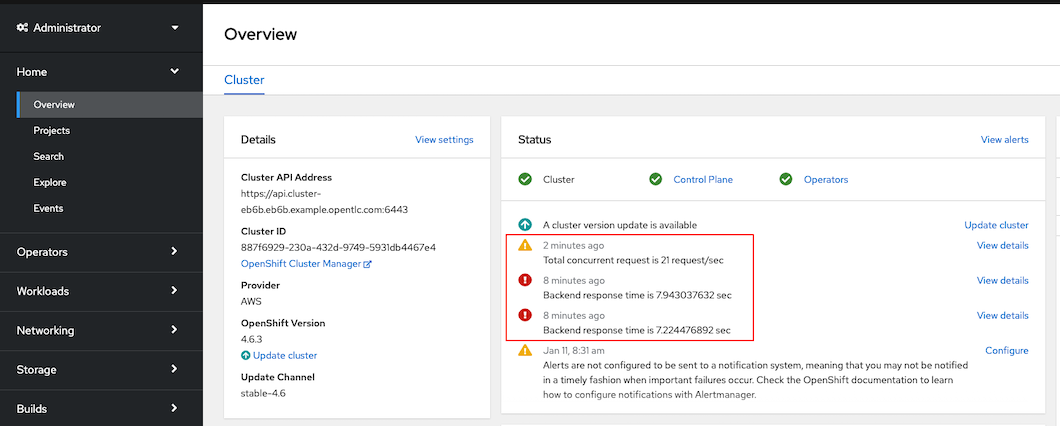
Console overview status
sum(increase(http_server_requests_seconds_count{outcome="SUCCESS"}[5m]))/sum(increase(http_server_requests_seconds_count[5m]))*100