Horizontal Pod Autoscaler (HPA)
CPU
Deploy frontend app (if you still not deploy it yet)
oc new-project project1
oc apply -f manifests/backend-v1.yaml -n project1
oc apply -f manifests/backend-service.yaml -n project1
oc apply -f manifests/backend-route.yaml -n project1
oc set env deployment backend-v1 -n project1 APP_BACKEND=https://httpbin.org/status/200
oc wait --for=condition=ready --timeout=60s pod -l app=backend
BACKEND_URL=http://$(oc get route backend -n project1 -o jsonpath='{.spec.host}')
curl -v -k $BACKEND_URL
Review CPU HPA for deployment backend
- Scale out when average CPU utilization is greater than 20% of CPU limit
- Maximum pods is 5
Scale down to min replicas if utilization is lower than threshold for 60 sec
  minReplicas: 1
  maxReplicas: 5
  targetCPUUtilizationPercentage: 20
  behavior:
    scaleDown:
      policies:
      - type: Pods
        value: 1
        periodSeconds: 60
      selectPolicy: Min
      stabilizationWindowSeconds: 70
    scaleUp:
      policies:
      - type: Pods
        value: 5
        periodSeconds: 70
      selectPolicy: Max
      stabilizationWindowSeconds: 0
oc apply -f manifests/backend-cpu-hpa.yaml -n project1
- Check HPA status
watch oc get horizontalpodautoscaler/backend-cpu -n project1
Output
NAME          REFERENCE            TARGETS         MINPODS   MAXPODS   REPLICAS   AGE
backend-cpu   Deployment/backend   <unknown>/20%   1         5         0          2m4s
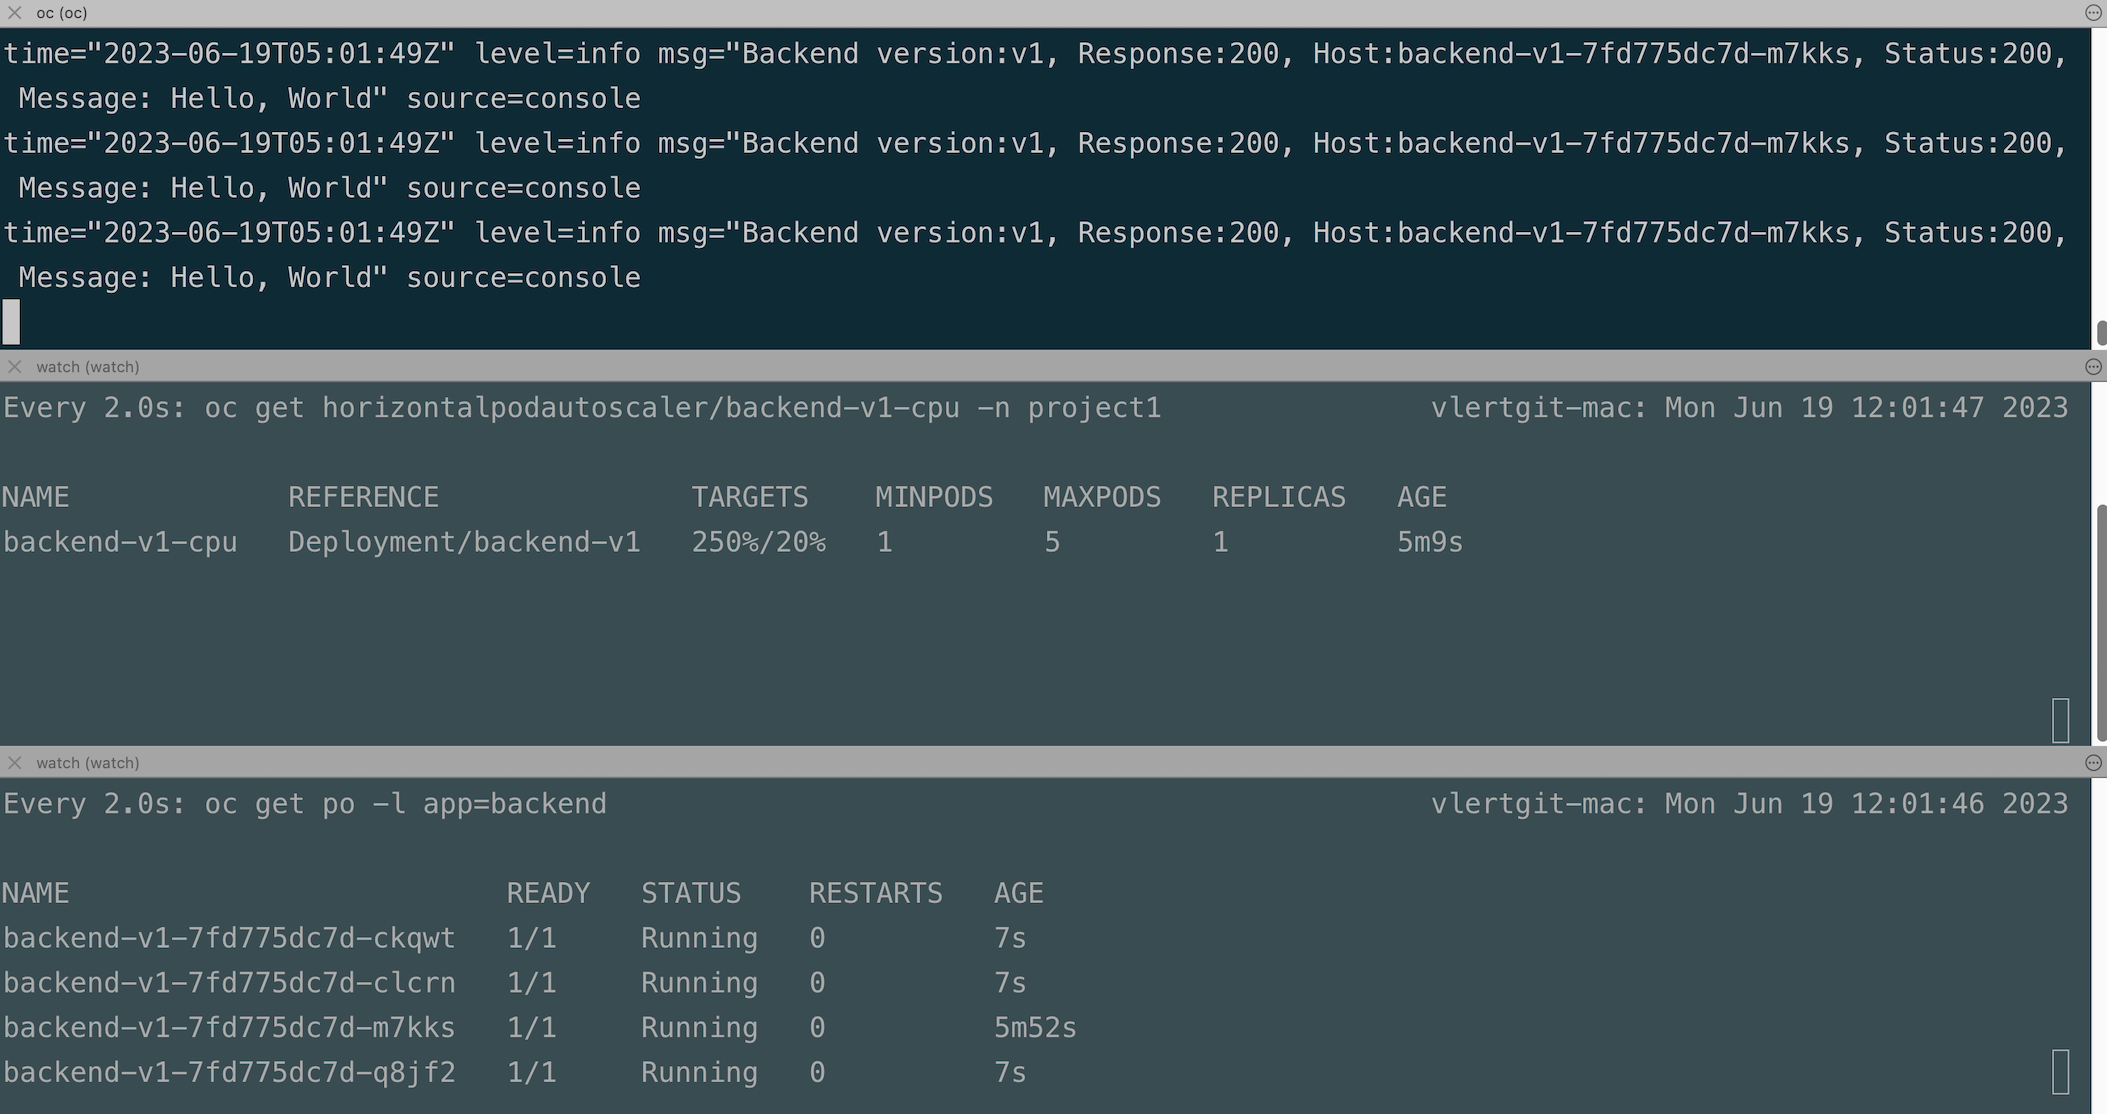
Load test with K6
- 50 threads
- Duration 3 minutes
- Ramp up 30 sec
Ramp down 30 sec
URL=http://backend.project1:8080
oc run load-test -n project1 -i \
--image=loadimpact/k6 --rm=true --restart=Never \
--  run -  < manifests/load-test-k6.js \
-e URL=$URL -e THREADS=50 -e DURATION=3m -e RAMPUP=30s -e RAMPDOWN=30s
Output
Check pods CPU in developer console
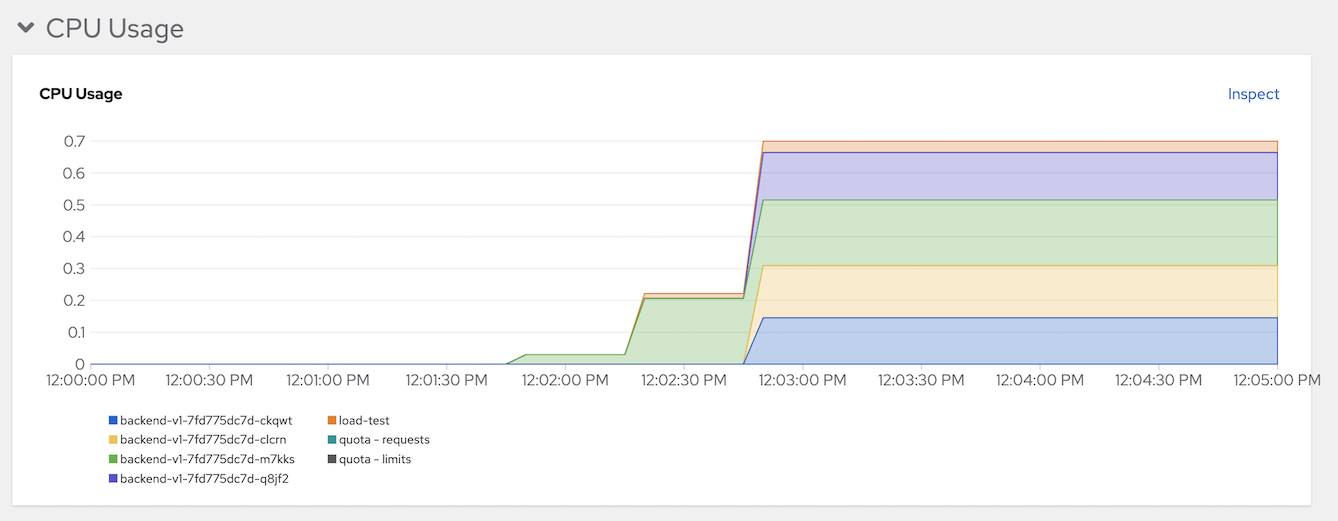
Stop load test and wait 1 minutes to scale down to 1 replica.

Remark: k6 will run as pod name
load-testfor 4 minutes if you want to force stop before 4 minutes just deleteload-testpodoc delete pod load-test -n project1Memory
Deploy Memory Leak App
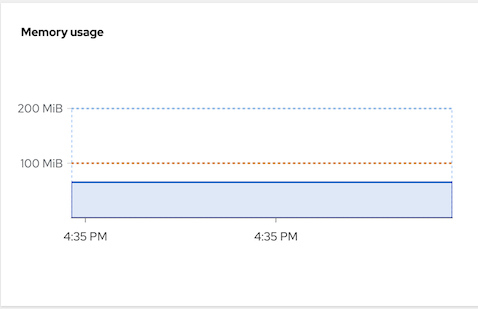
      resources:
        requests:
          cpu: "0.1"
          memory: 100Mi
        limits:
          cpu: "0.2"
          memory: 200Mi
      env:
        - name: APP_DISHSIZE
          value: "10485760"
Deploy Leak App
oc apply -f manifests/leak.yaml -n project1
oc expose deployment leak -n project1
oc expose svc leak -n project1
Check for leak app memory limit
Review Memory HPA for deployment leak app
- Scale out when average memory utilization is greater than 100Mi
- Maximum pods is 3
Scale down to min replicas if utilization is lower than threshold for 60 sec
Create Memory HPA for deployment frontend v1
oc apply -f manifests/leak-memory-hpa.yaml -n project1Check HPA status
watch oc get horizontalpodautoscaler/leak-memory -n project1Output
NAME          REFERENCE         TARGETS          MINPODS   MAXPODS   REPLICAS   AGE
leak-memory   Deployment/leak   81829888/100Mi   1         3         1          5h37m
Test Leak App to consume another 30 MB
curl -v http://$(oc get route leak -n project1 -o jsonpath='{.spec.host}')/eat/3
watch oc get po -l app=leak -n project1
Output
< HTTP/1.1 200 OK
< content-type: text/plain;charset=UTF-8
< content-length: 20
< set-cookie: 5ba5938c43542864828d859a0c1ca92a=00adce54797d4ef2002e330336942b56; path=/; HttpOnly
< cache-control: private
<
* Connection #0 to host leak-project1.apps.cluster-27h8w.27h8w.sandbox74.opentlc.com left intact
Added 31457280 bytes
Check that another leak pod is created
NAME                    READY   STATUS    RESTARTS   AGE
leak-74d885844d-s4vjz   1/1     Running   0          26s
leak-74d885844d-vrx6s   1/1     Running   0          2m45s
Check HPA status again
NAME          REFERENCE         TARGETS           MINPODS   MAXPODS   REPLICAS   AGE
leak-memory   Deployment/leak   127311872/100Mi   1         3         2          97s
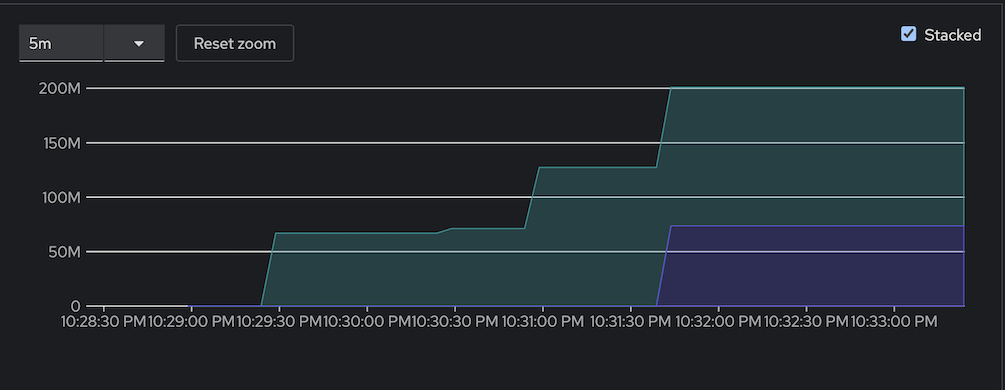
Check memory utilization from Developer console
Custom Metrics Autoscaler
Configure User Workload Monitoring
- Enable user workload monitoring
Create Service Monitoring to monitor backend service
PROJECT=project1
oc new-project $PROJECT
oc apply -f manifests/backend-service-monitor.yaml -n $PROJECT
Remove HPA by CPU and run K6 with 10 threads
  oc delete hpa/backend-cpu -n project1
  URL=http://backend.project1:8080
  oc run load-test -n project1 -i \
  --image=loadimpact/k6 --rm=true --restart=Never \
  --  run -  < manifests/load-test-k6.js \
  -e URL=$URL -e THREADS=10 -e DURATION=3m -e RAMPUP=30s -e RAMPDOWN=30s
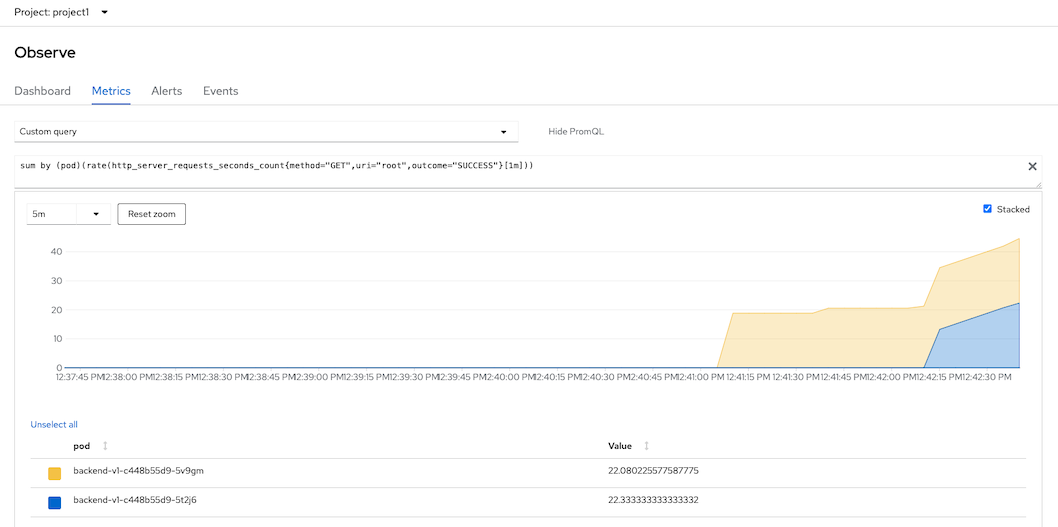
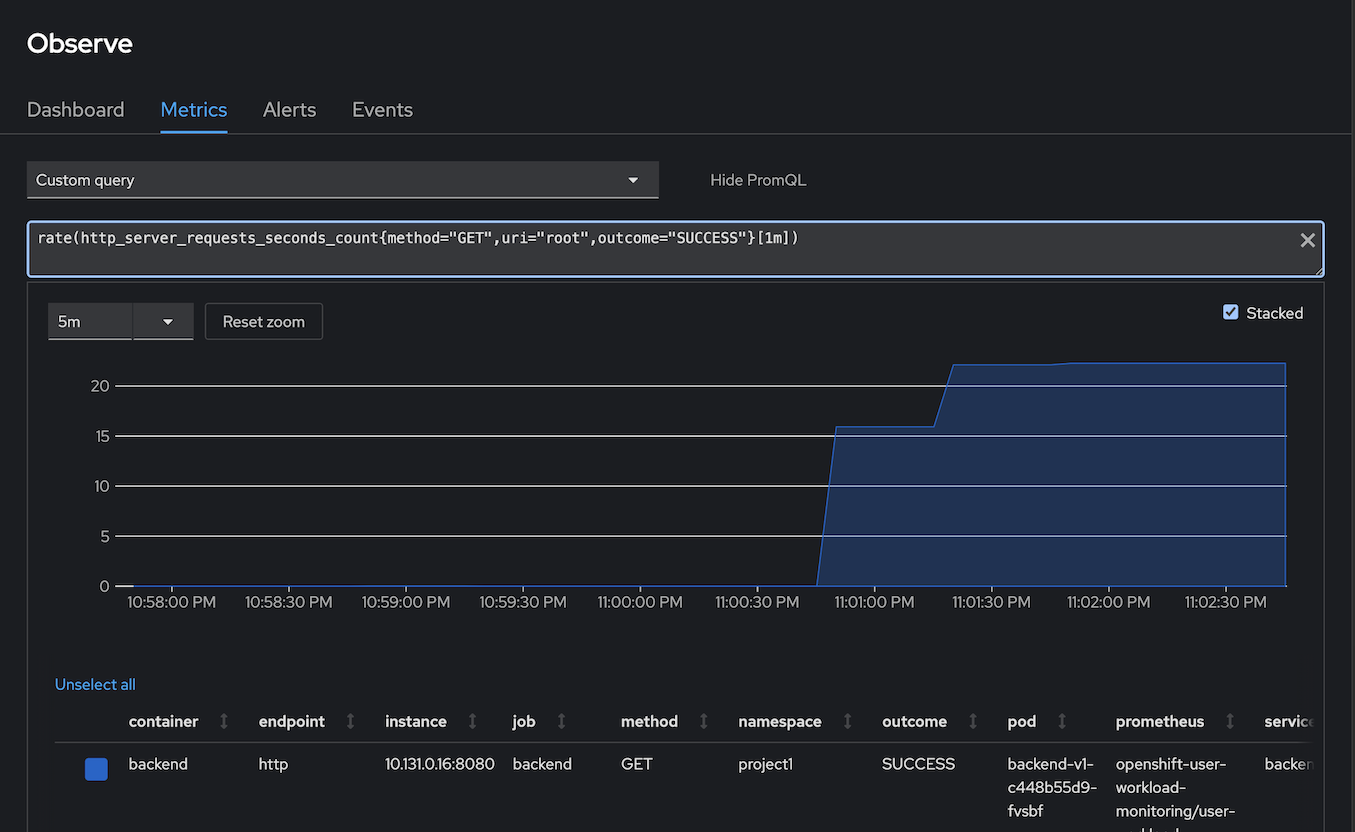
Check for backends's concurrent requests/sec metric
- Open Developer Console -> Observe -> Metrics -> Custom metrics
Input following PromQL to check for number of requests/min
rate(http_server_requests_seconds_count{method="GET",uri="root",outcome="SUCCESS"}[1m])Output
Install Operator
Install Custom Metrics Autoscaler Operator
Verify
oc get csv -n openshift-keda
oc get po -n openshift-keda
Output
NAME                                    DISPLAY                          VERSION     REPLACES                                PHASE
custom-metrics-autoscaler.v2.15.1-4     Custom Metrics Autoscaler        2.15.1-4    custom-metrics-autoscaler.v2.14.1-467   Succeeded
NAME                                                  READY   STATUS    RESTARTS   AGE
custom-metrics-autoscaler-operator-7cd9b44885-wq44x   1/1     Running   0          40s
Create KedaController
oc apply -f manifests/keda-controller.yamlVerify
oc get po -l app=keda-operator -n openshift-kedaOutput
NAME                             READY   STATUS    RESTARTS   AGE
keda-operator-5cc8fdbc7f-m7ldj   1/1     Running   0          113s
SacledObject
Create Service Account
oc create serviceaccount thanos -n $PROJECTCreate Secert for serviceaccount thanos
oc create -f manifests/sa-thanos-secret.yaml -n $PROJECTCreate TriggerAuthentication and assign cluster role to query thanos
cat manifests/cma-trigger-authentication.yaml|sed 's/PROJECT/'$PROJECT'/' | oc create -f -
oc adm policy add-cluster-role-to-user cluster-monitoring-view -z thanos -n $PROJECT
Create ScaledObject to scale backend pod by conncurrent request.
cat manifests/backend-scaled-object.yaml|sed 's/PROJECT/'$PROJECT'/' | oc create -f -
oc get scaledobject/backend -o yaml -n $PROJECT | grep -A4 " conditions:"
oc get scaledobject/backend -n $PROJECT
oc get hpa -n $PROJECT
oc get po -l app=backend -n $PROJECT
Number of replicas and triggers configuration
triggers:
    - authenticationRef:
        kind: TriggerAuthentication
        name: keda-trigger-auth-prometheus
      metadata:
        metricName: http_server_requests_seconds_count
        namespace: project1
        query: sum(rate(http_server_requests_seconds_count{method="GET", uri="root", outcome="SUCCESS"}[1m])) by (pod)
        serverAddress: https://thanos-querier.openshift-monitoring.svc.cluster.local:9092
        threshold: "10"
        authModes: "bearer"
Output
 scaledobject.keda.sh/backend created
 conditions:
 - message: ScaledObject is defined correctly and is ready for scaling
   reason: ScaledObjectReady
   status: "True"
   type: Ready
ScaledObject Status
NAME      SCALETARGETKIND      SCALETARGETNAME   MIN   MAX   TRIGGERS     AUTHENTICATION                 READY   ACTIVE   FALLBACK   PAUSED    AGE
backend   apps/v1.Deployment   backend-v1        1     15    prometheus   keda-trigger-auth-prometheus   True    False    Unknown    Unknown   2s
HPA is created
NAME               REFERENCE               TARGETS      MINPODS   MAXPODS   REPLICAS   AGE
keda-hpa-backend   Deployment/backend-v1   0/10 (avg)   2         15        2          54s
Check pod
NAME                          READY   STATUS    RESTARTS   AGE
backend-v1-687db7677c-4mn6t   1/1     Running   0          112s
backend-v1-687db7677c-qbkjb   1/1     Running   0          13h
Test
Run Load Test with K6
URL=http://backend:8080
oc run load-test -n project1 -i \
--image=loadimpact/k6 --rm=true --restart=Never \
--  run -  < manifests/load-test-k6.js \
-e URL=$URL -e THREADS=200 -e DURATION=3m -e RAMPUP=30s -e RAMPDOWN=30s
Check that ScaledObject is active
NAME      SCALETARGETKIND      SCALETARGETNAME   MIN   MAX   TRIGGERS     AUTHENTICATION                 READY   ACTIVE   FALLBACK   PAUSED    AGE
backend   apps/v1.Deployment   backend-v1        1     15    prometheus   keda-trigger-auth-prometheus   True    True     False      Unknown   2m
Check that backend is scaled out
NAME                         READY   STATUS    RESTARTS   AGE
backend-v1-c448b55d9-5t2j6   1/1     Running   0          13s
backend-v1-c448b55d9-5v9gm   1/1     Running   0          129m
Check concurent request. Open Developer Console and use custom query
sum by (pod)(rate(http_server_requests_seconds_count{method="GET",uri="root",outcome="SUCCESS"}[1m]))