Metrics-driven mastery: How to monitor, alert & scale like a Pro
OpenShift Monitoring
OpenShift Container Platform includes a preconfigured, preinstalled, and self-updating monitoring stack that provides monitoring for core platform components. You also have the option to enable monitoring for user-defined projects.
A cluster administrator can configure the monitoring stack with the supported configurations. OpenShift Container Platform delivers monitoring best practices out of the box.
A set of alerts are included by default that immediately notify administrators about issues with a cluster. Default dashboards in the OpenShift Container Platform web console include visual representations of cluster metrics to help you to quickly understand the state of your cluster. With the OpenShift Container Platform web console, you can access metrics and manage alerts.
After installing OpenShift Container Platform, cluster administrators can optionally enable monitoring for user-defined projects. By using this feature, cluster administrators, developers, and other users can specify how services and pods are monitored in their own projects. As a cluster administrator, you can find answers to common problems such as user metrics unavailability and high consumption of disk space by Prometheus in Troubleshooting monitoring issues.
Monitoring stack architecture
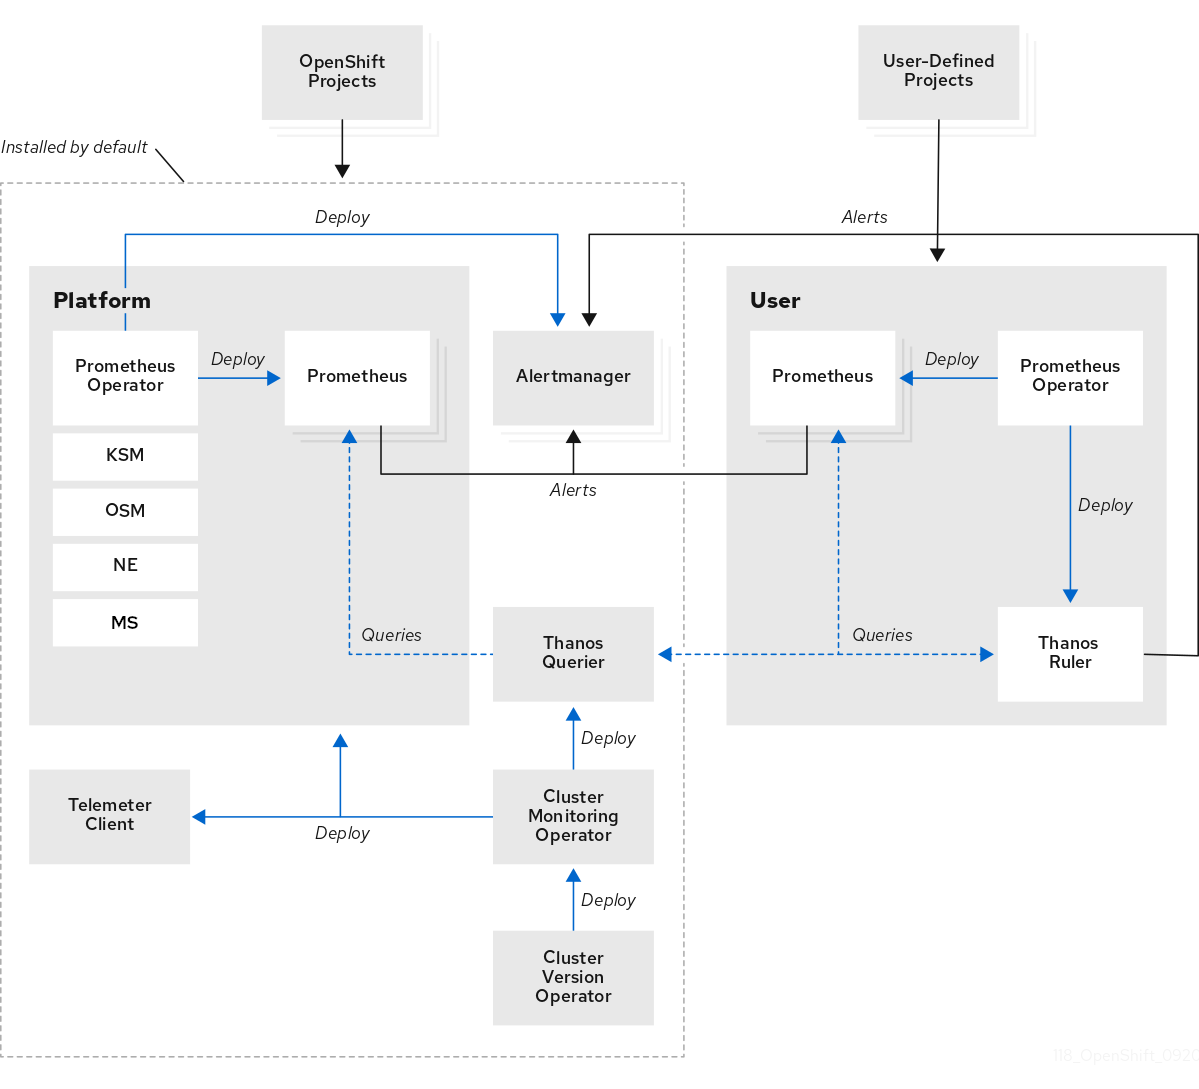
The OpenShift Container Platform monitoring stack is based on the Prometheus open source project and its wider ecosystem. The monitoring stack includes default monitoring components and components for monitoring user-defined projects.
The monitoring stack includes the following components:
-
Default platform monitoring components. A set of platform monitoring components are installed in the
openshift-monitoringproject by default during an OpenShift Container Platform installation. This provides monitoring for core cluster components including Kubernetes services. The default monitoring stack also enables remote health monitoring for clusters. These components are illustrated in the Installed by default section in the diagram below. -
user-defined projects monitoring components. After optionally enabling monitoring for user-defined projects, additional monitoring components are installed in the
openshift-user-workload-monitoringproject. This provides monitoring for user-defined projects. These components are illustrated in the User section in the diagram.
Visit this link for more information about OpenShift Monitoring.
Monitor your application
OpenShift provides a bunch of default out-of-the-box monitoring dashboard for you to monitor your applications deployed in the cluster. In OpenShift console, select Topology menu on the left. Then change to project userX-observe that matches to your username (if it’s not already).
-
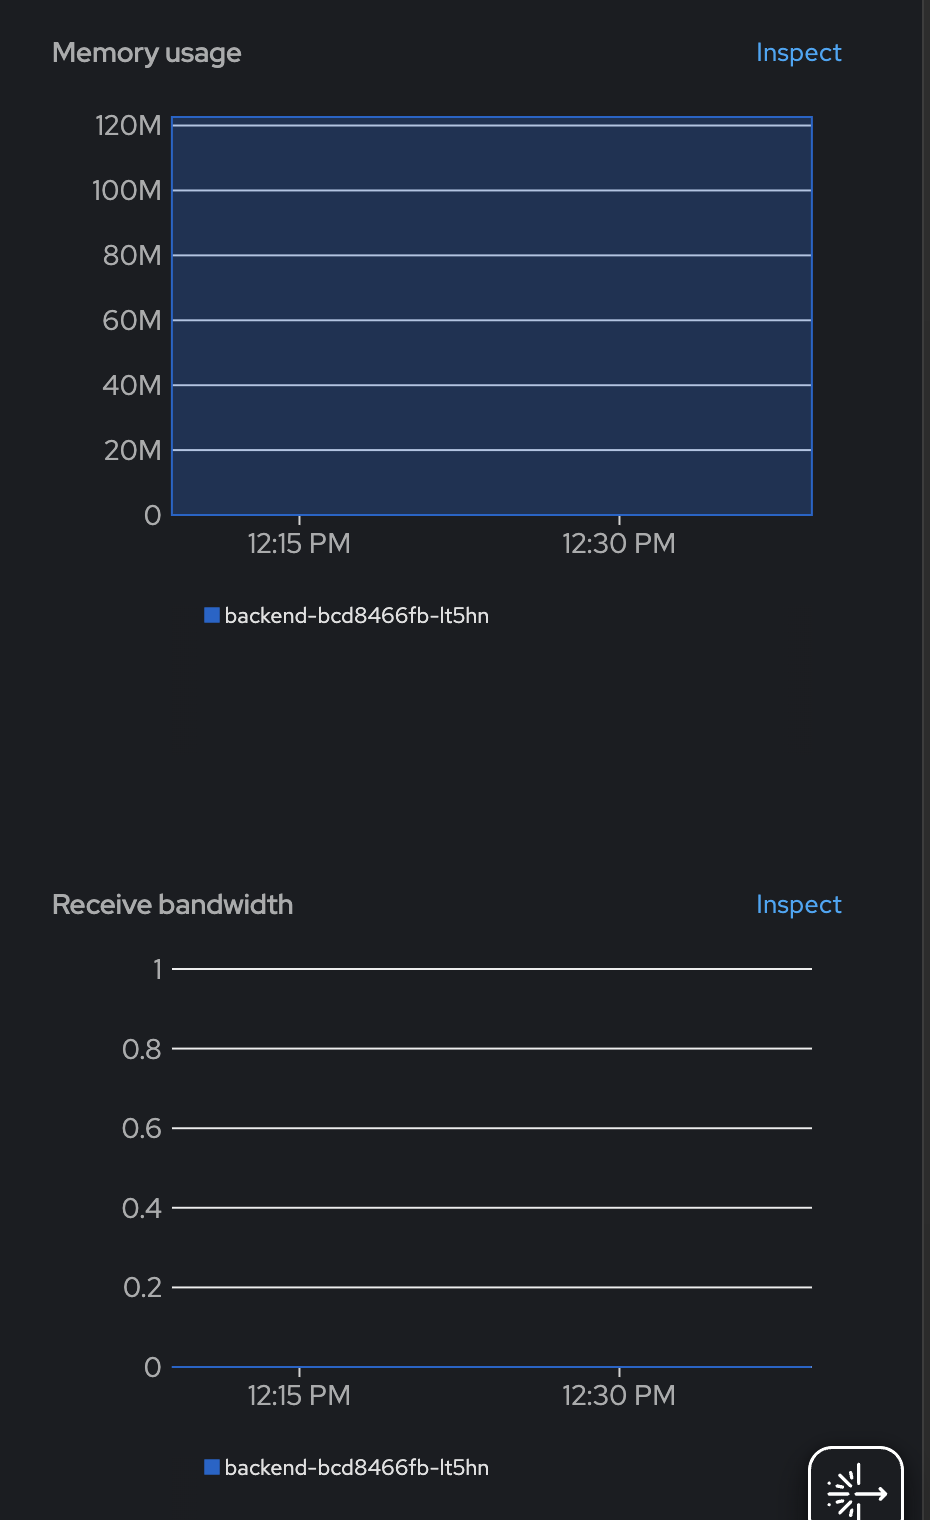
Click on the
backendDeployment, then select Observe tab on the right panel. You can see the CPU usage, Memory usage, and network bandwidth.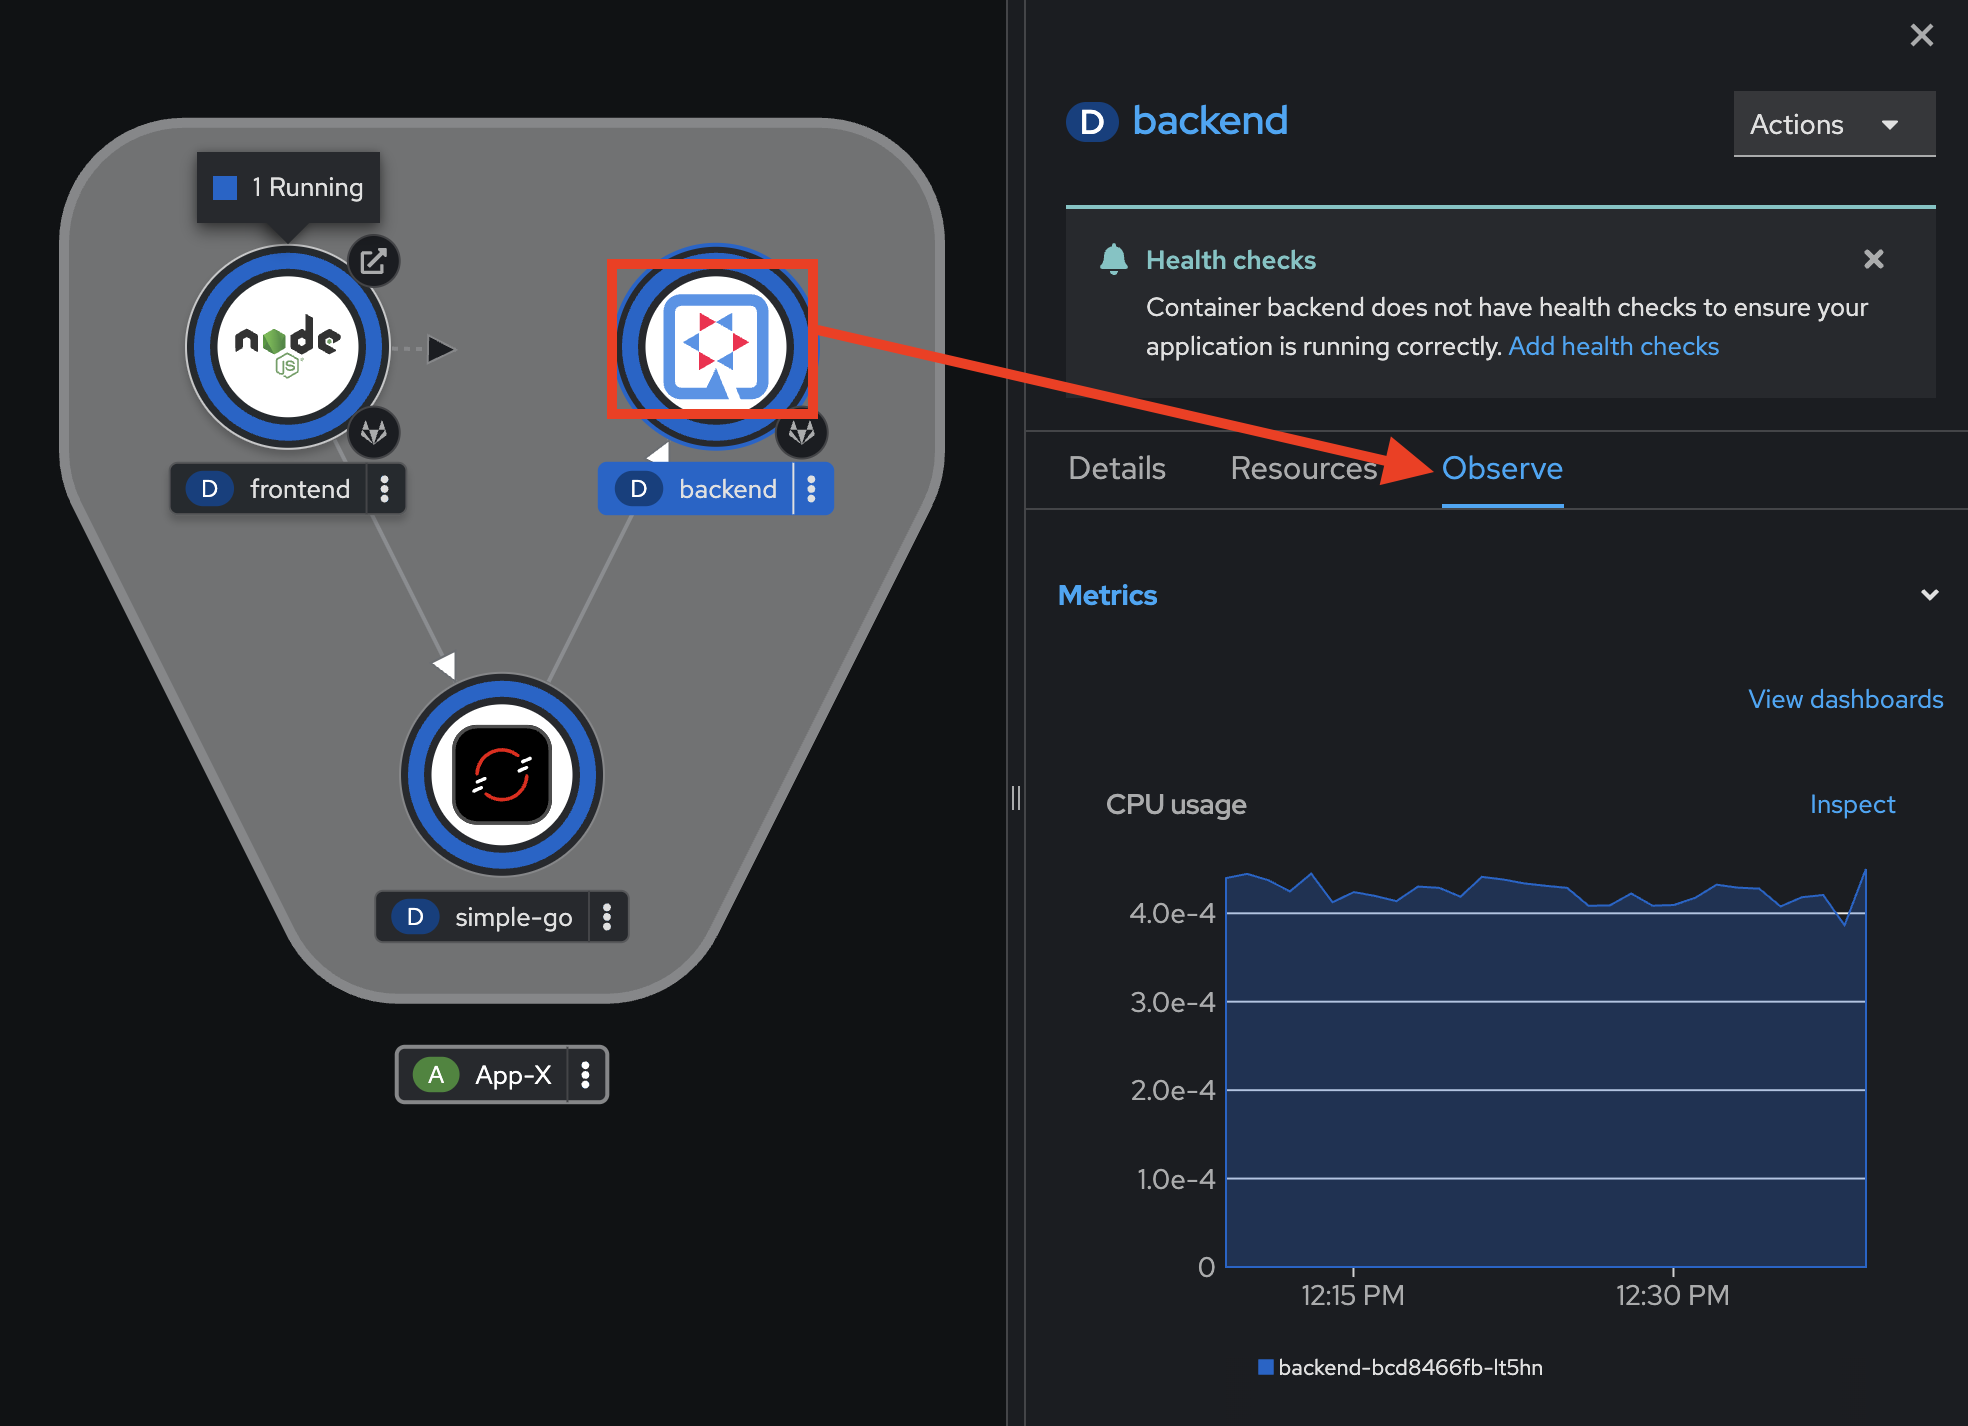
-
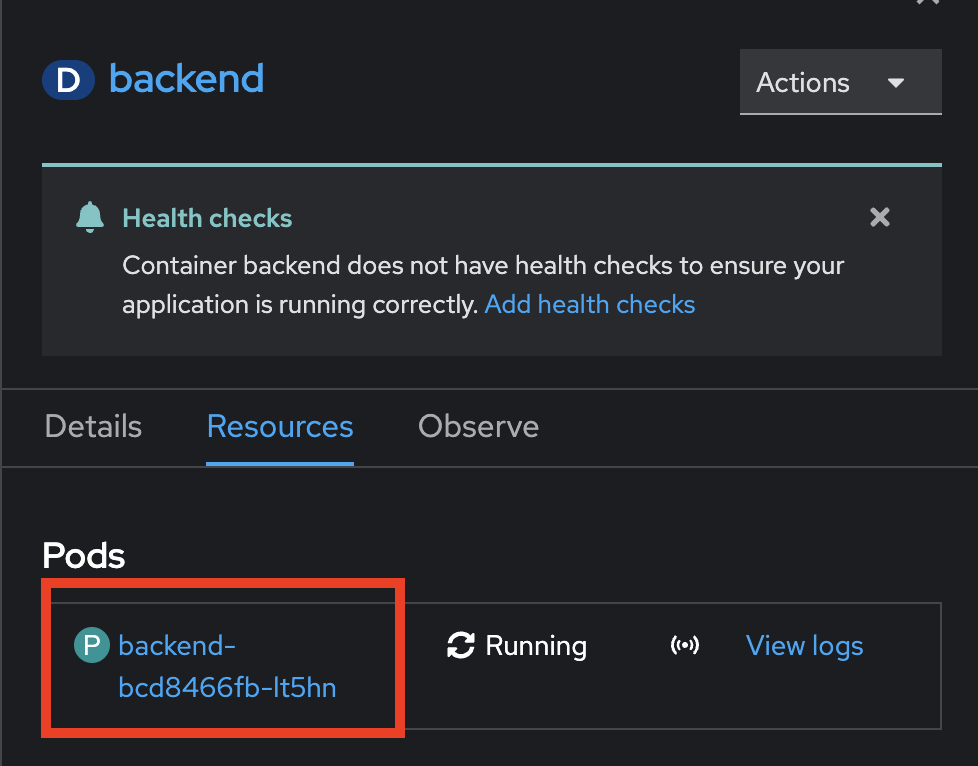
To view more monitoring information for a specific Pod in this deployment, click on Resources tab, then click on the Pod to view monitoring details for a particular Pod.
-
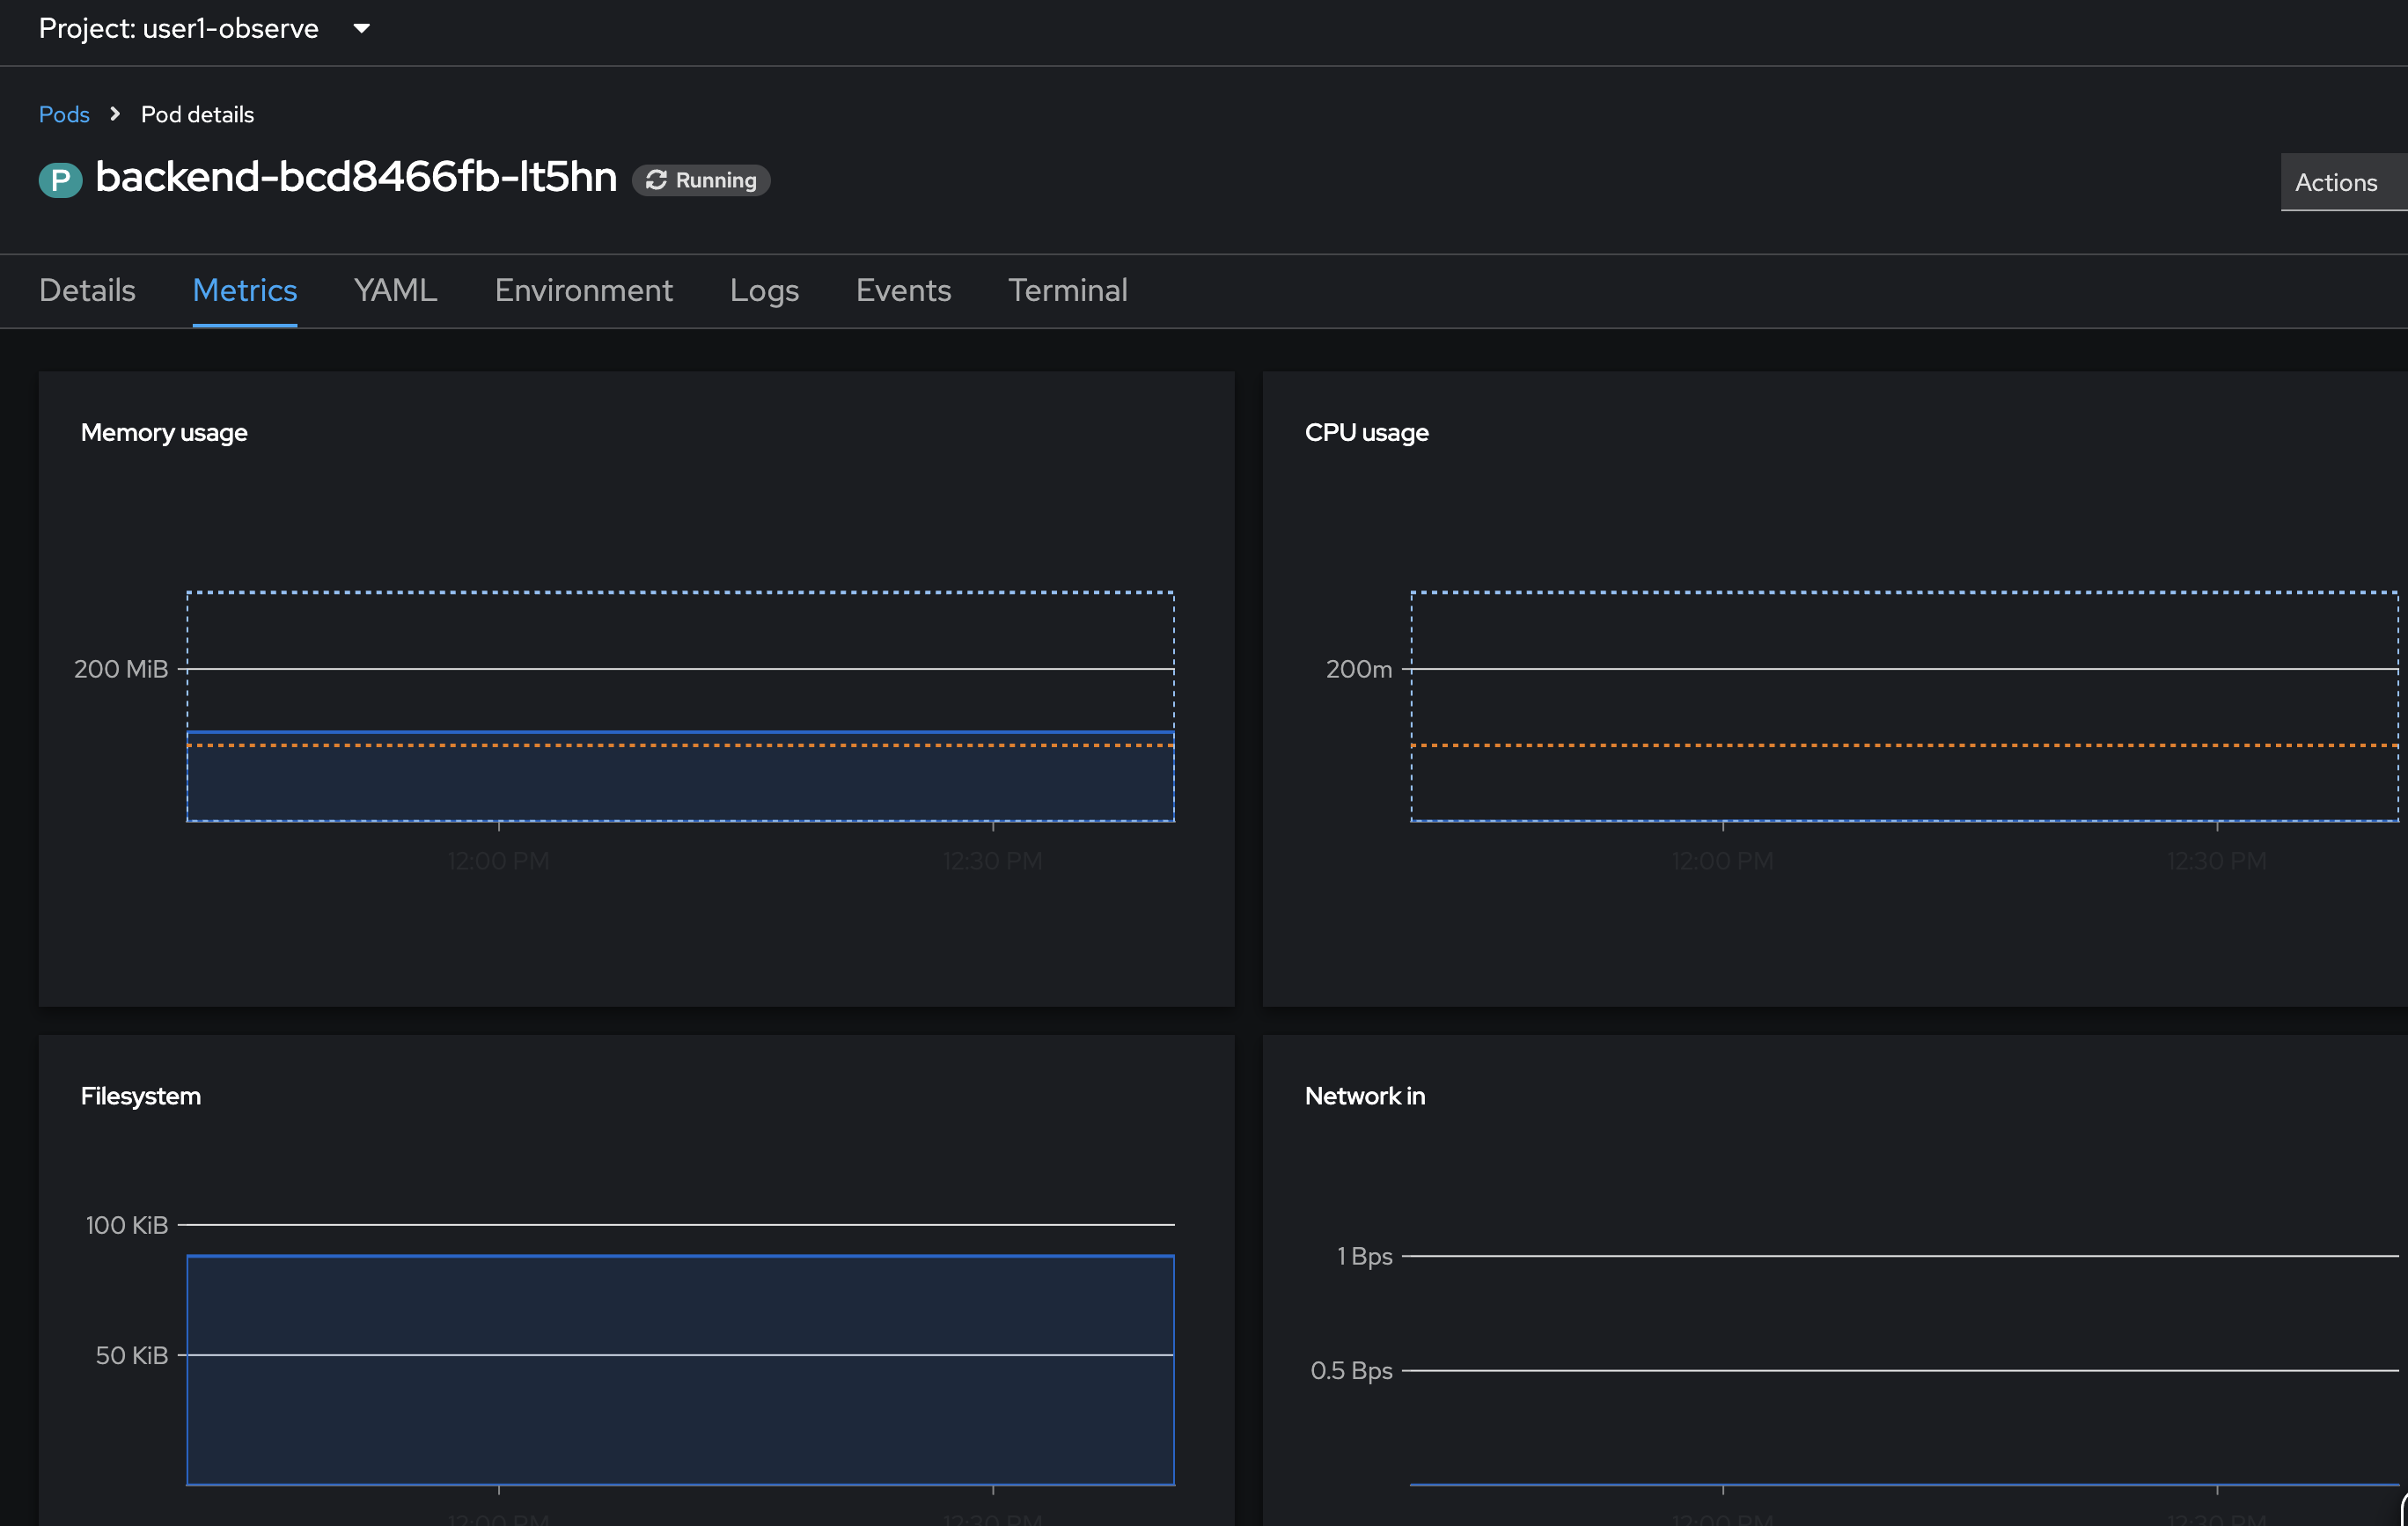
In Pod Details page, select Metrics tab to view monitoring infomation e.g. Memory usage, CPU usage, Filesystem, and Network for this Pod.
-
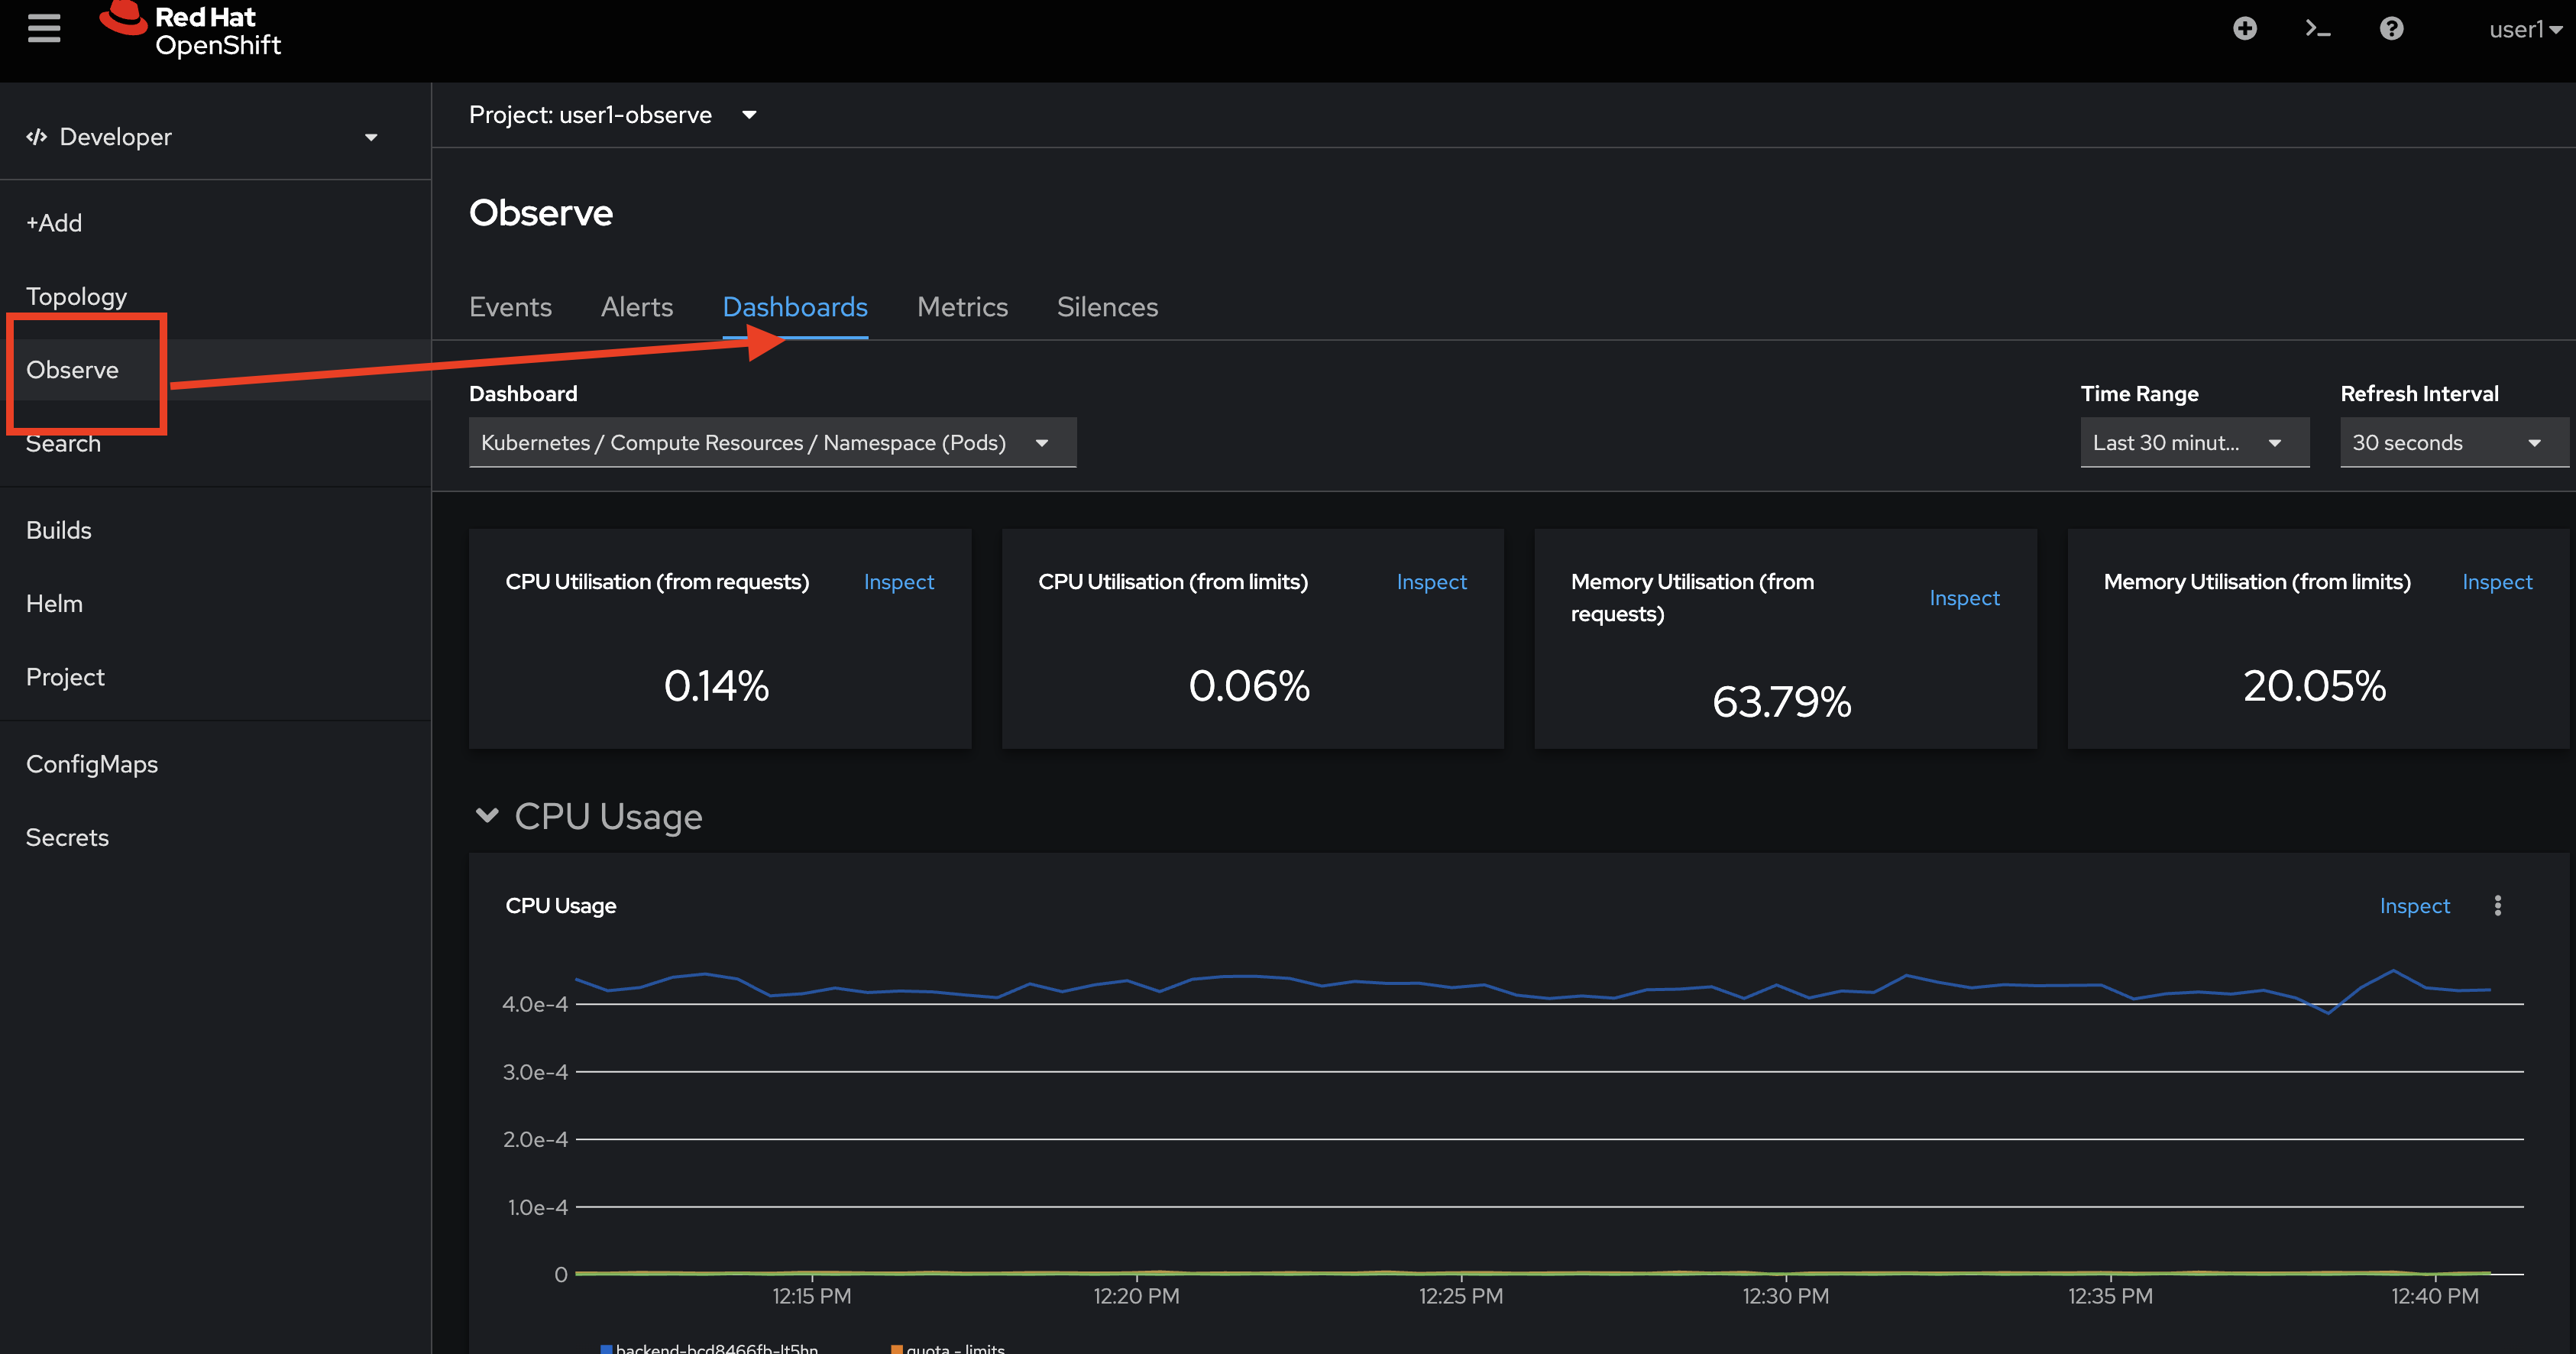
To monitor all deployments in this Project, click Observe menu on the left, then select Dashboards tab, default dashboard will show all monitoring information of all Pods in this namespace/Project.
-
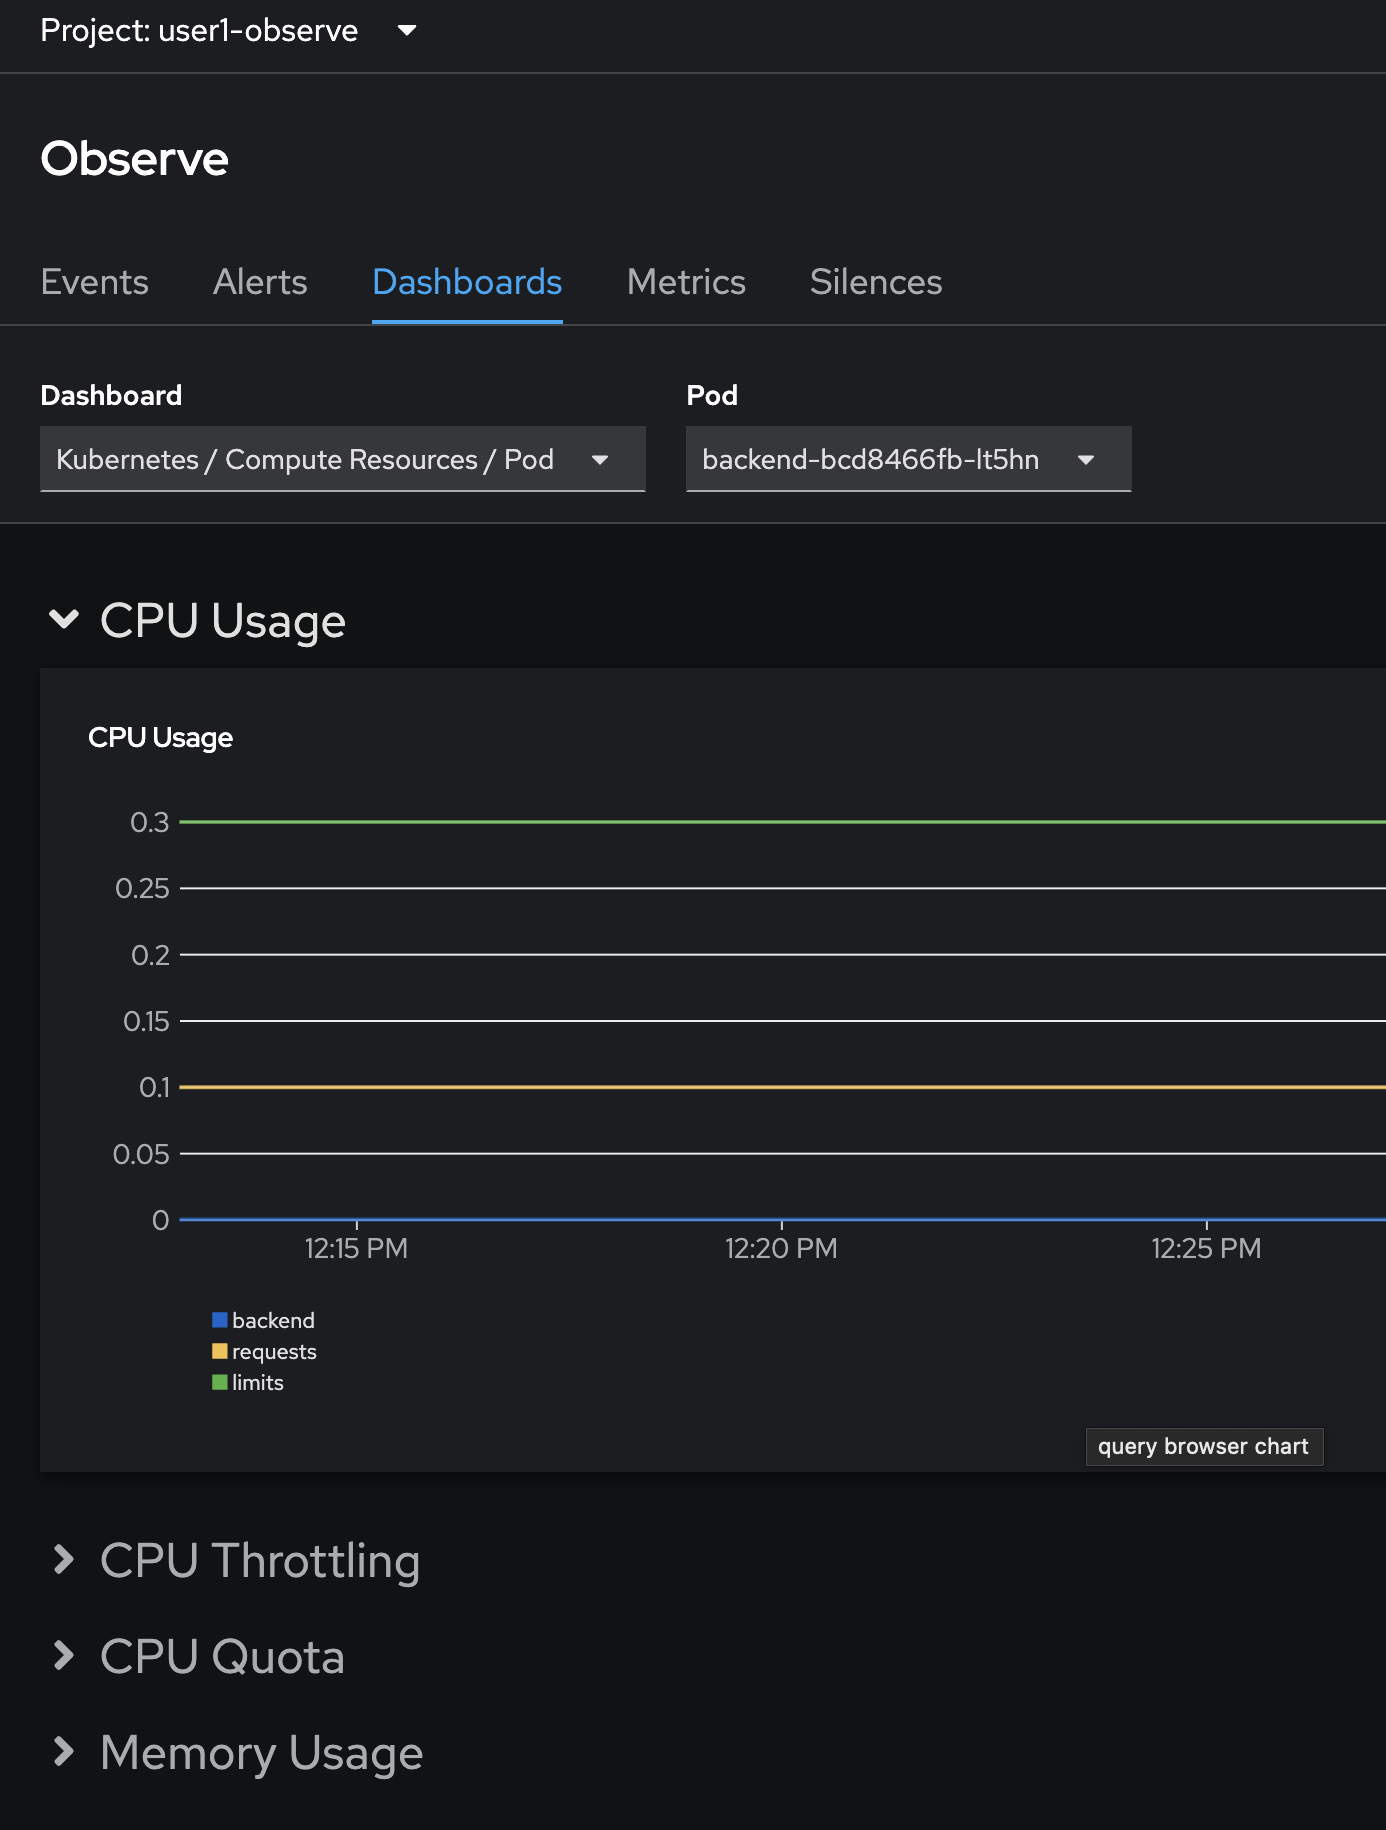
You can view different dashboards by select a dashboard from the Dashboard dropdownlist i.e.
Kubernetes/Compute Resources/Poddashboard to filter and view Pod-specific monitoring information.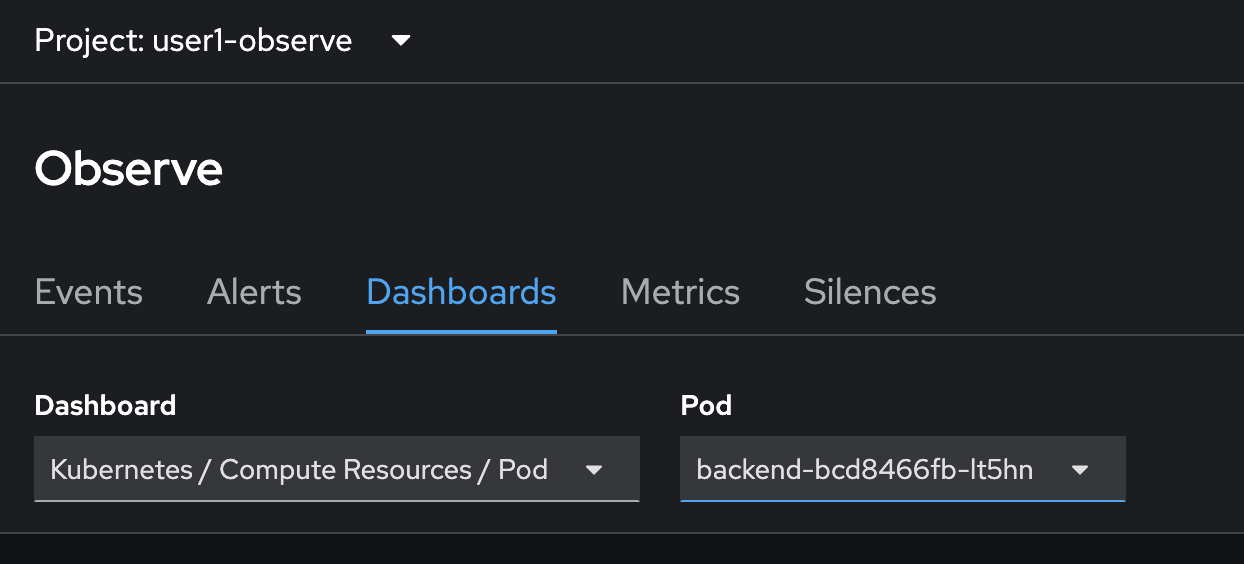
-
The dashboard will show fundamental application monitoring information such as CPU, Memory, Disk, Network etc.
All the graphs you’ve seen in the dashboard are rendered from metrics data collected from the resources deployed in OpenShift cluster. OpenShift Monitoring uses Prometheus to collect and store all metrics in the cluster.
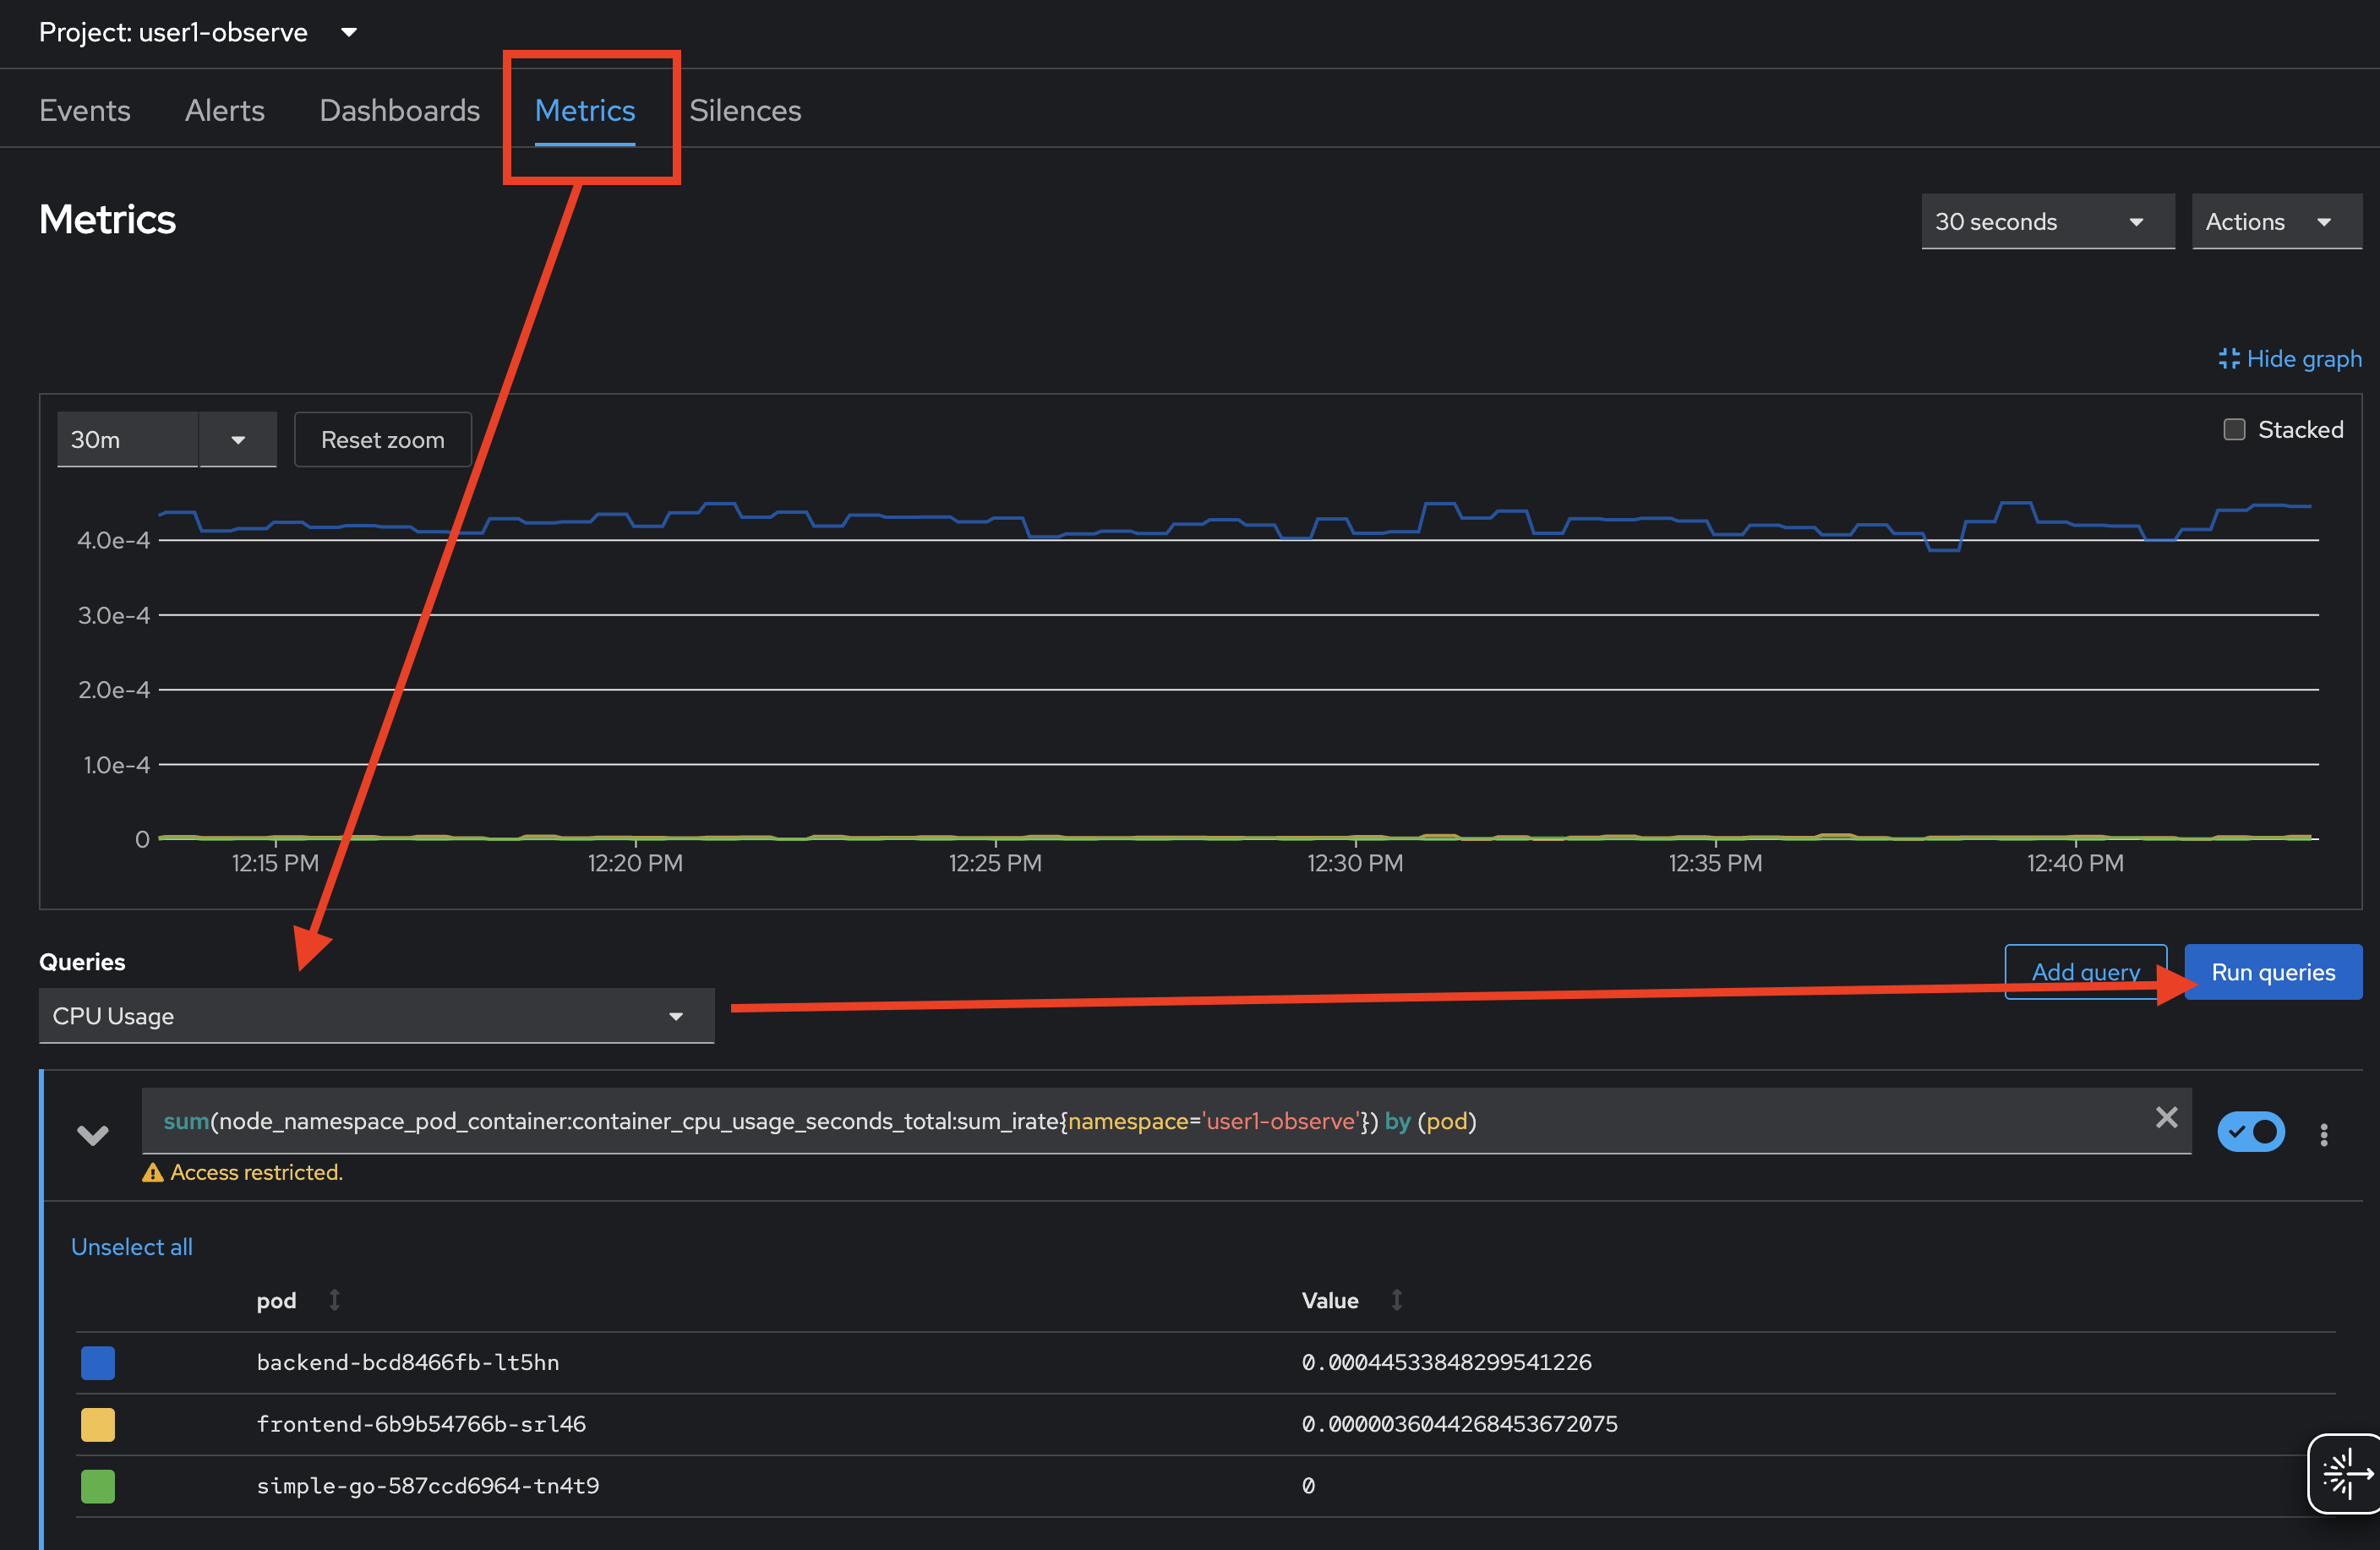
To query metrics, select Metrics tab, then select built-in queries from the Query dropdownlist to query metrics information such as cpu usage, memory usage, filesystem usage, etc. then click on Run queries button.
-
select
CPU Usagequery, run the query and then select the Stacked checkbox to stack the line chart.Try to select different queries in the Query dropdownlist to see different metrics information. 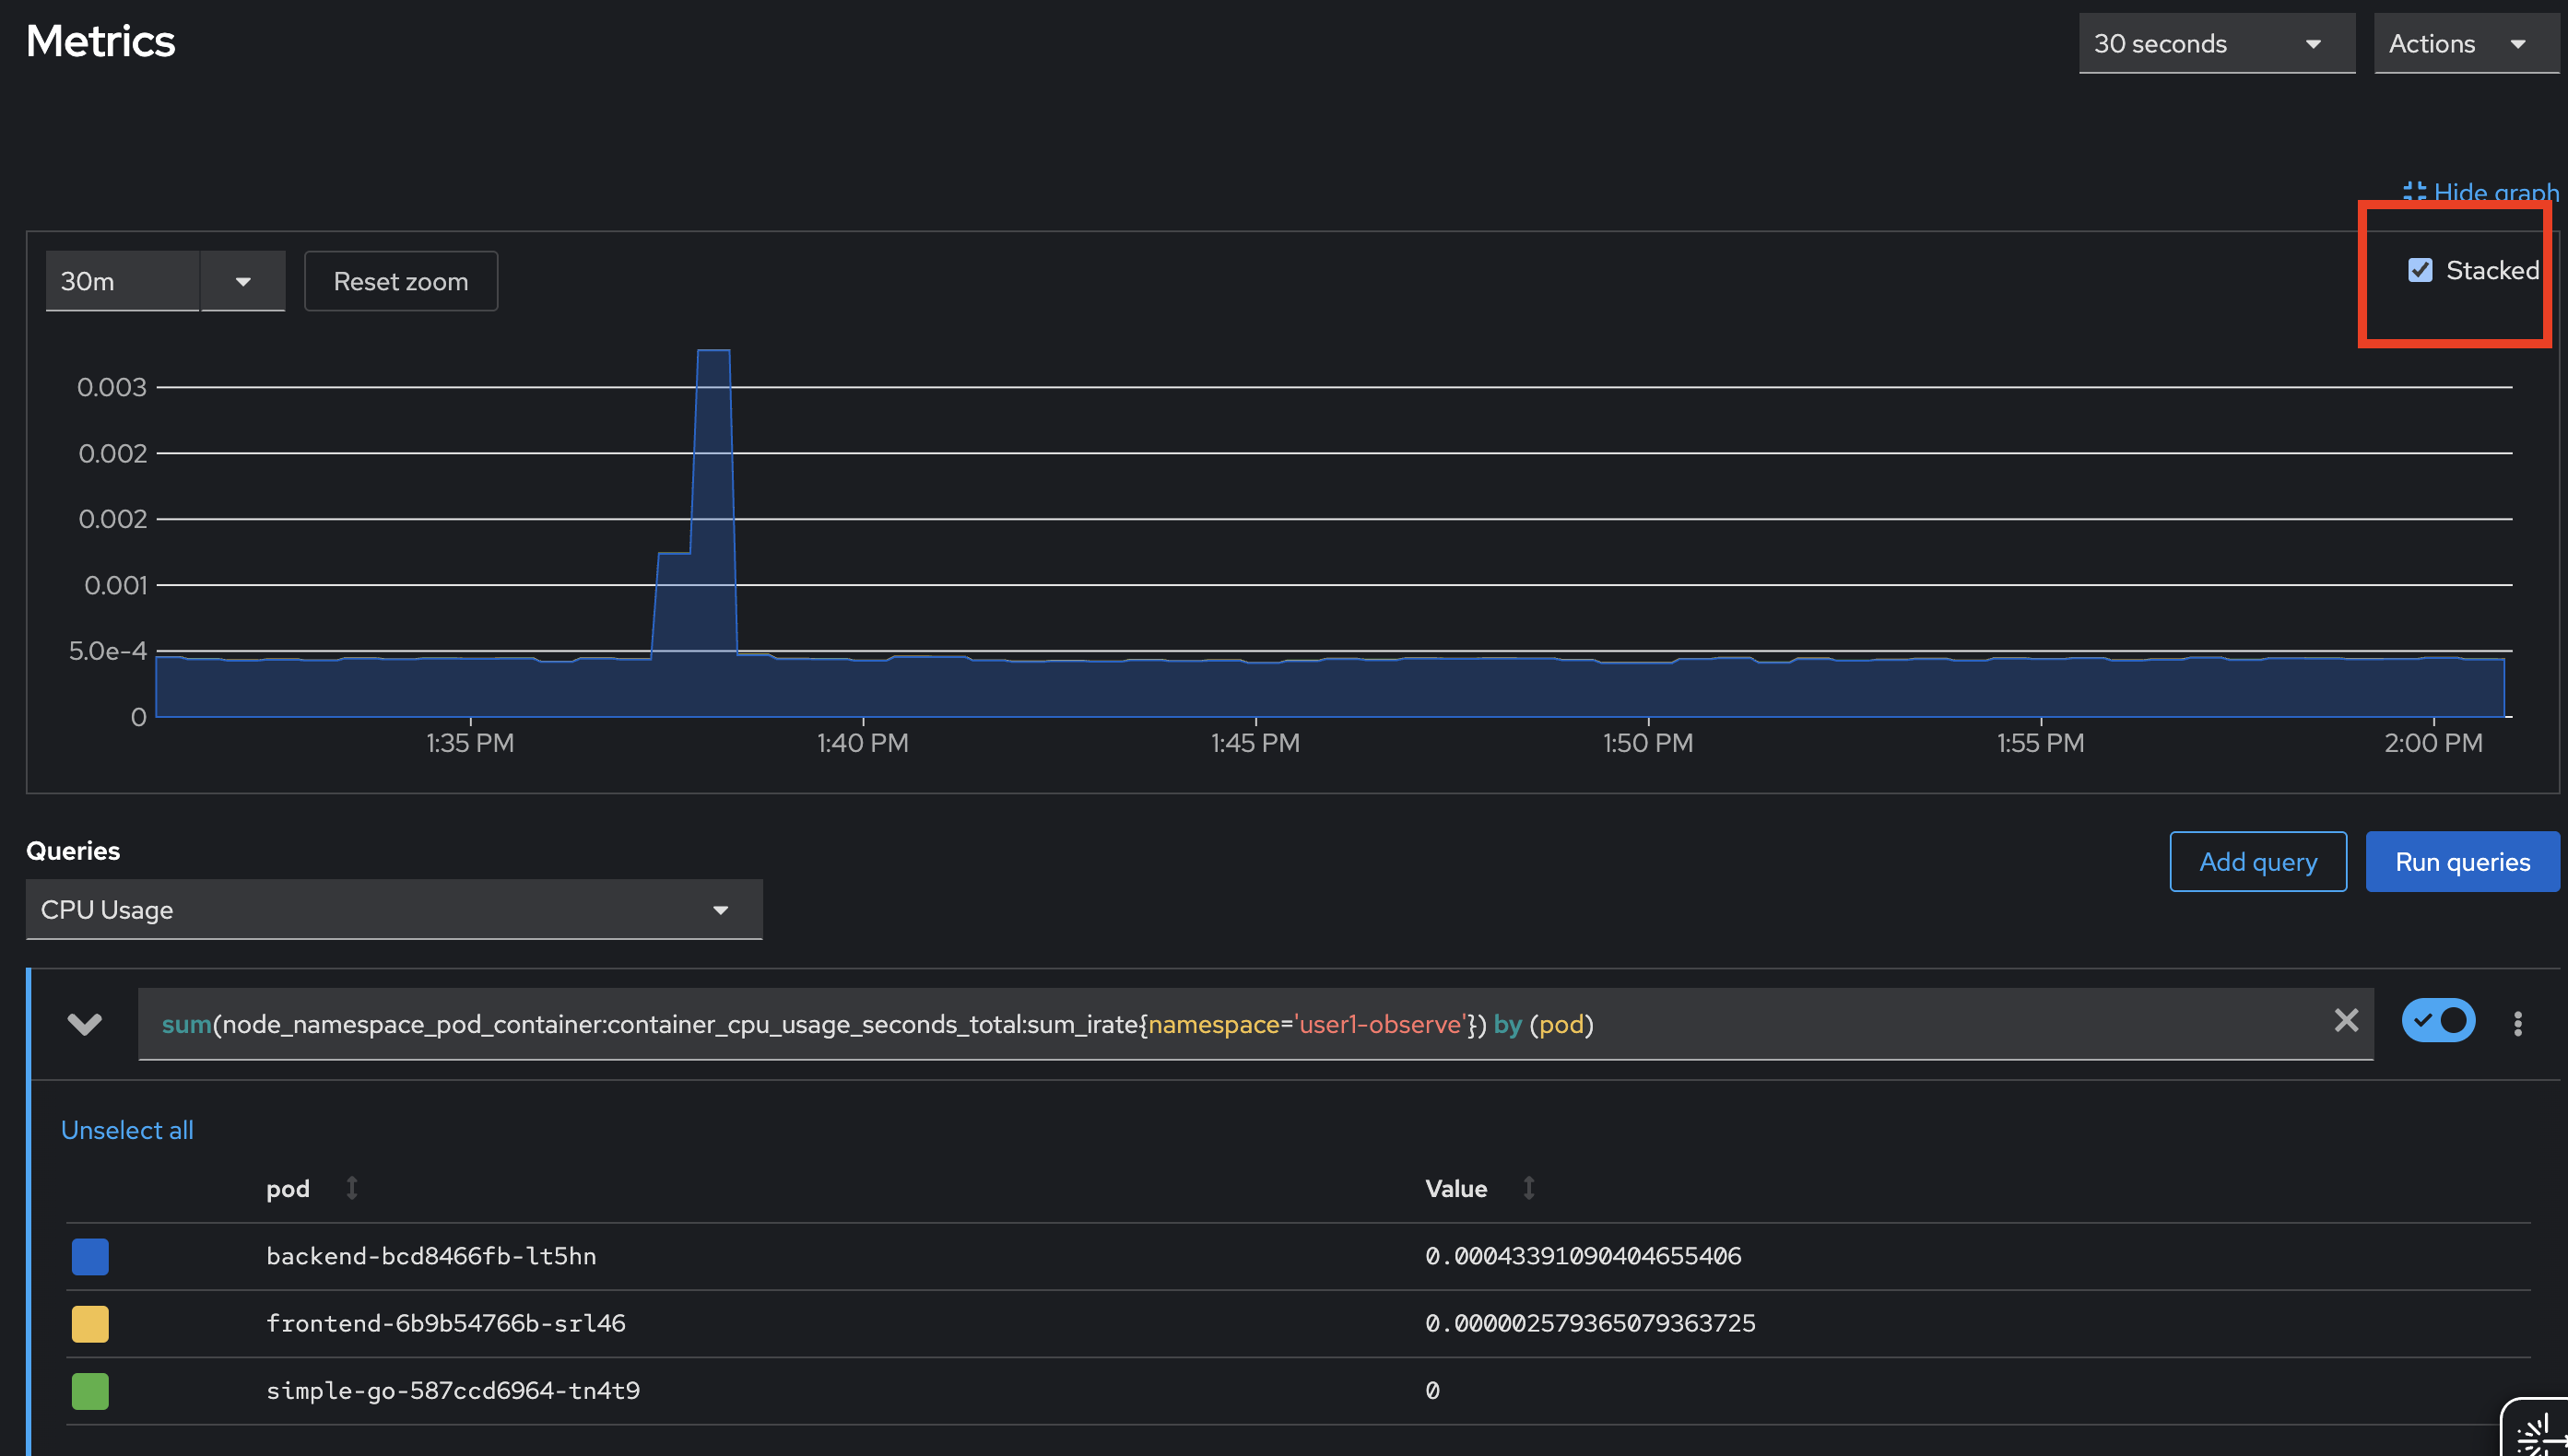
-
You can use PromQL (Prometheus Query Language) to query metrics information with custom query as well. Delete existing query then type
container_cpuin the expression input and wait for auto suggestion.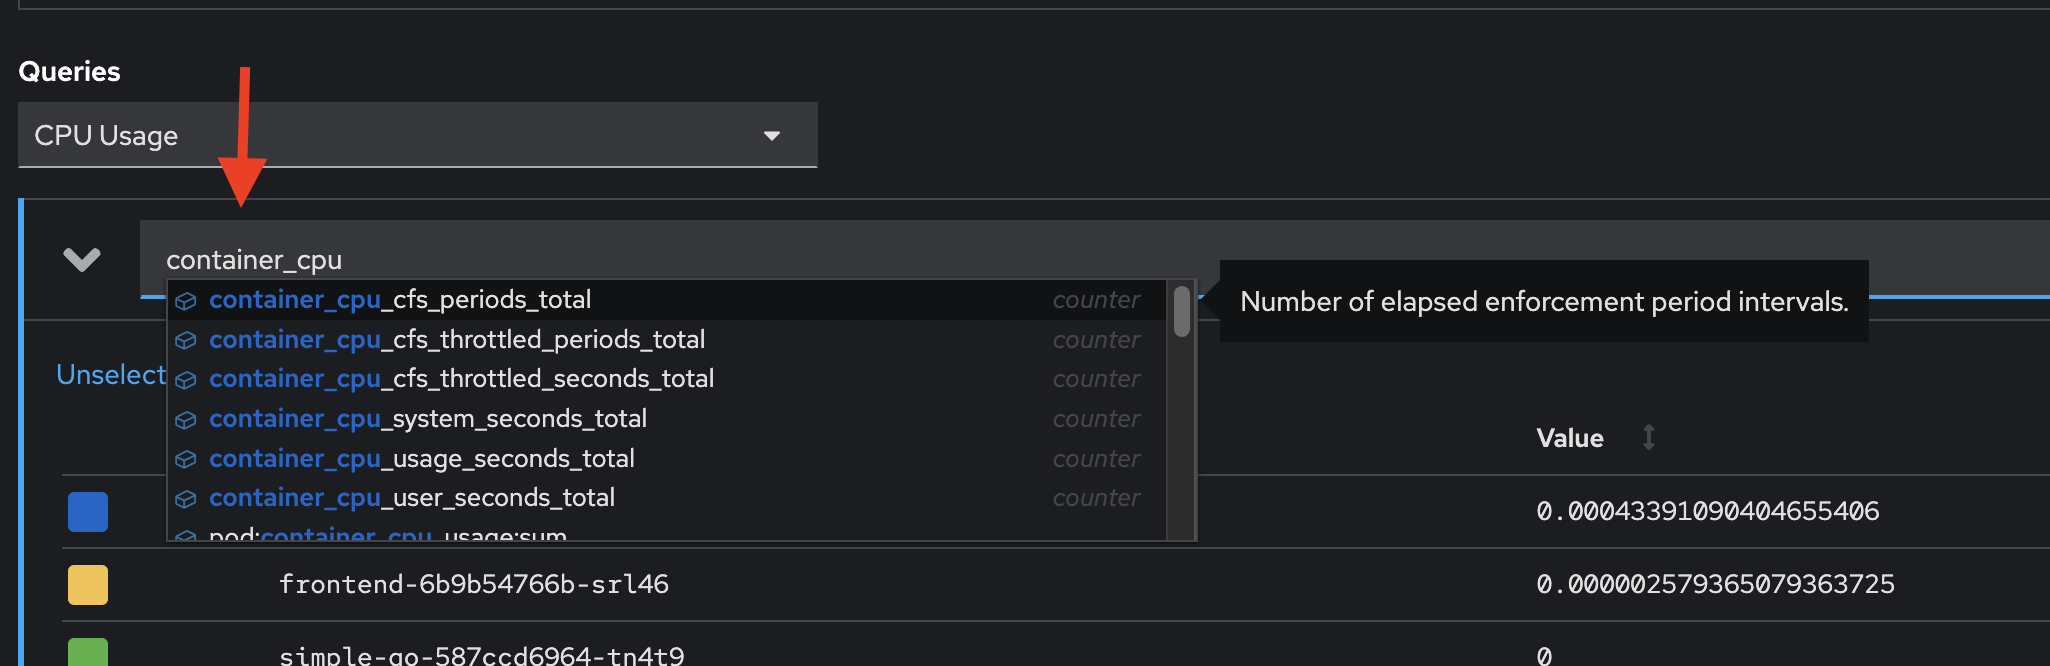
-
select
container_cpu_usage_seconds_totalmetric then pressEnteron keyboard to query the metric from Prometheus.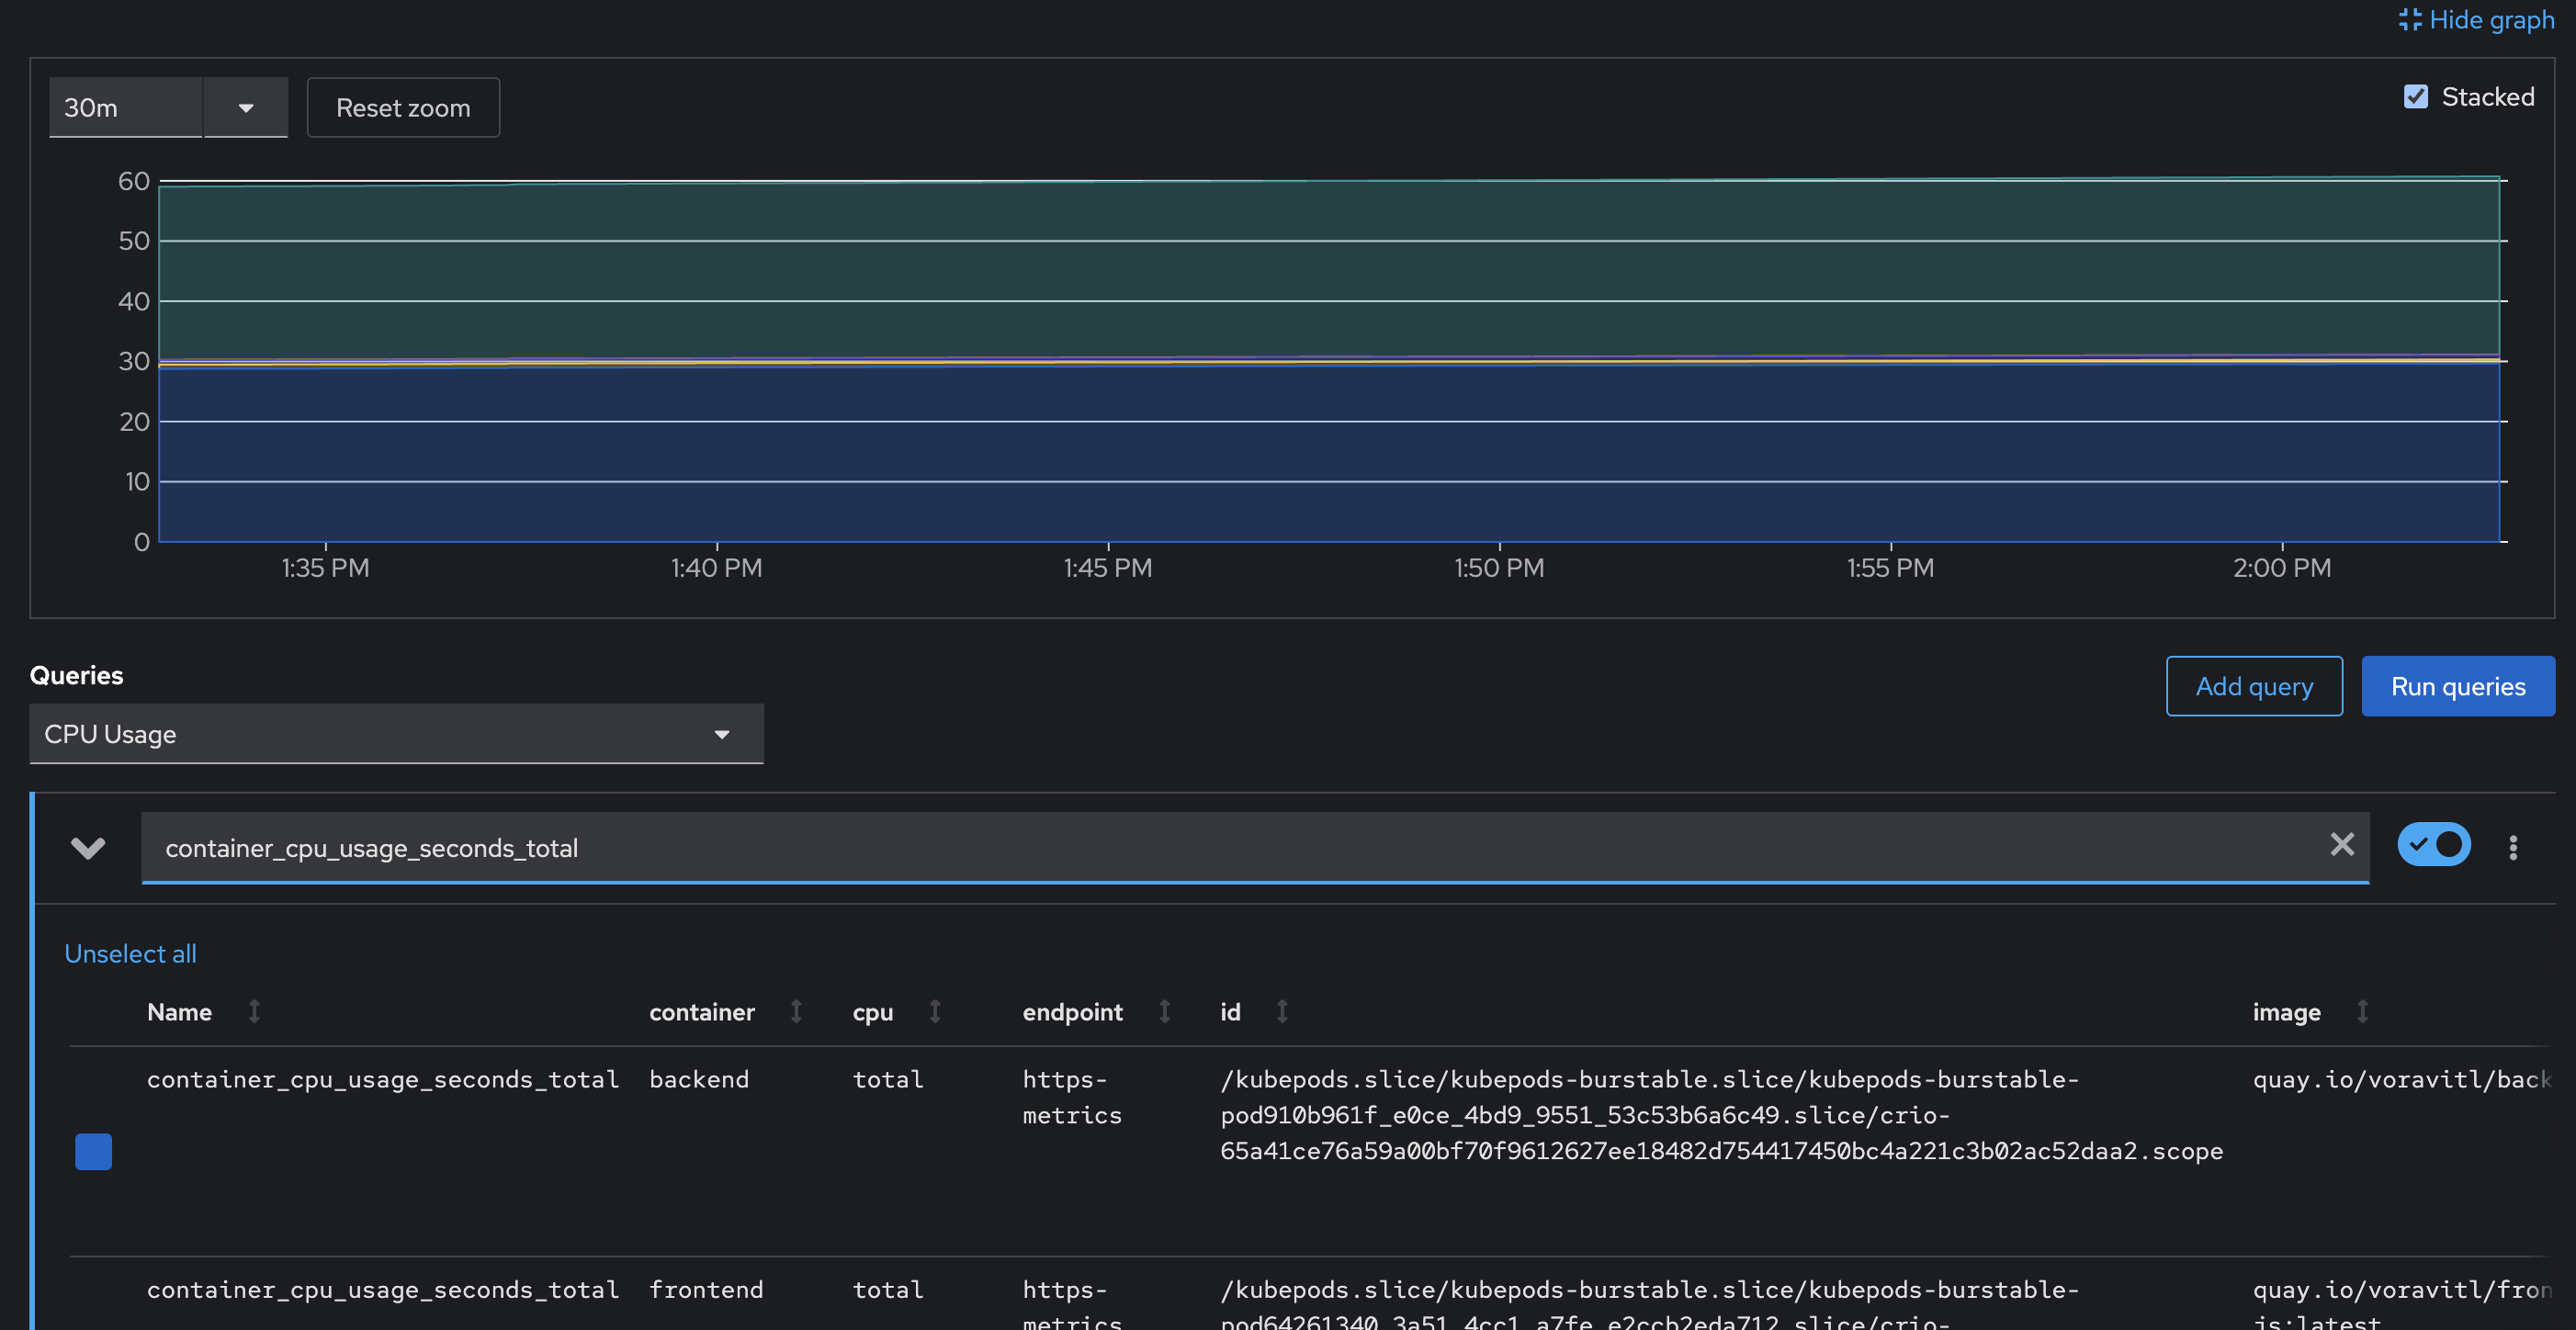
-
Try new query by enter
pod:container_cpu_usage:sumto expression input then pressEnterto run query.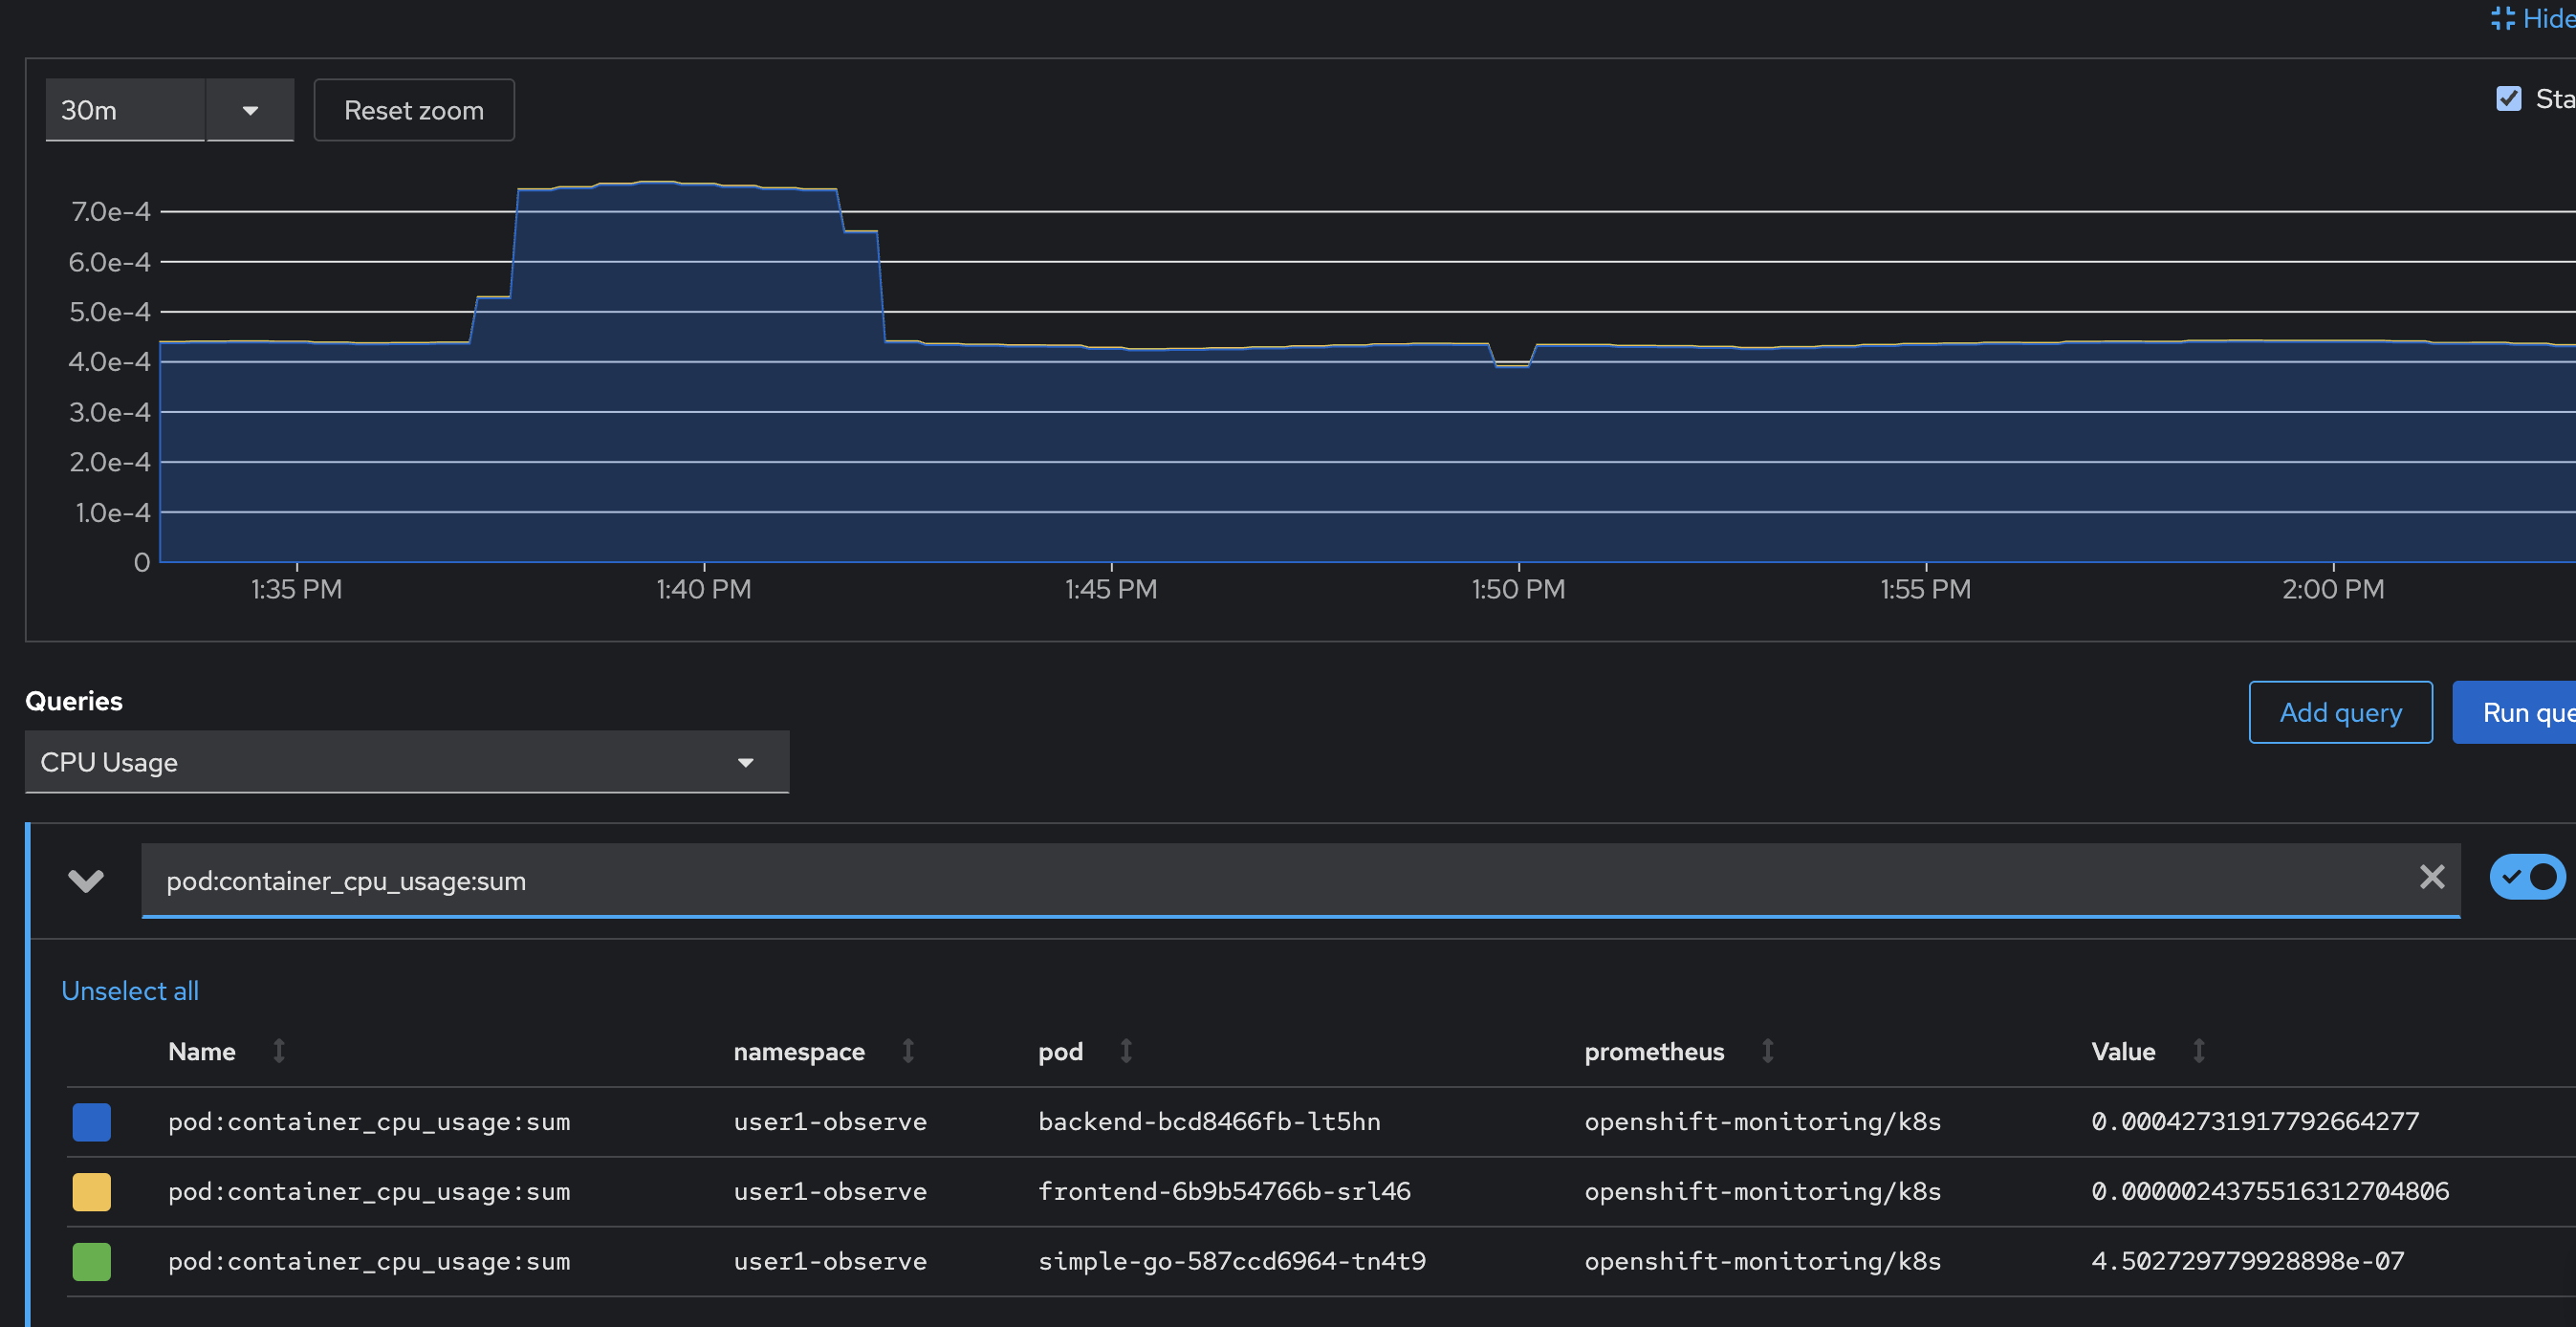
-
In the web browser address bar, you can see the URL for the query you’ve just run. You can save or bookmark this URL for later use.

-
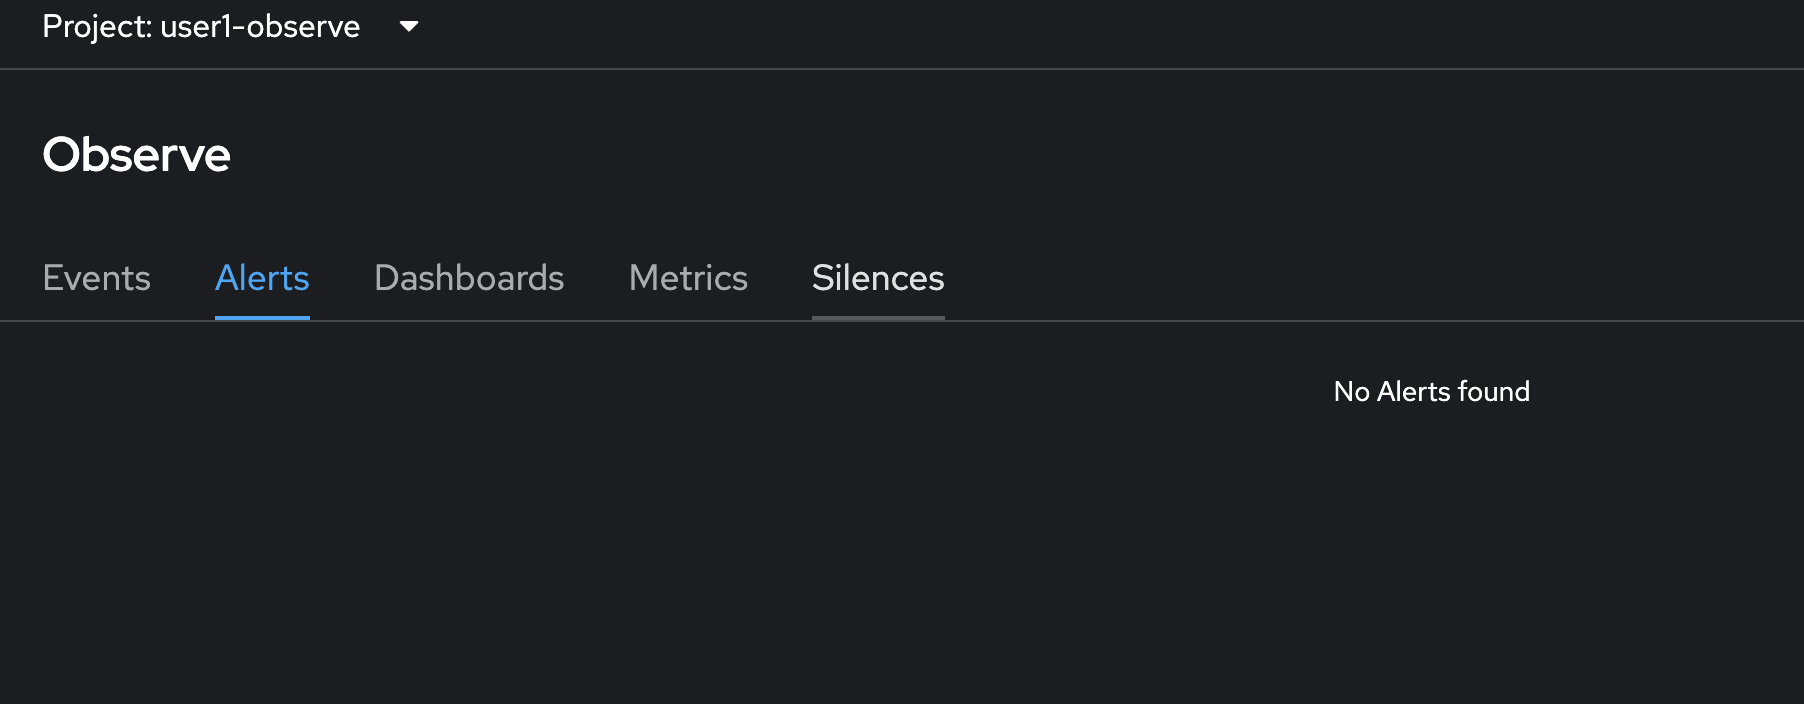
Click Alerts tab to view all alerts (if any). The Alerting UI enables you to manage alerts, silences, and alerting rules. We will create alert later in this lab.
-
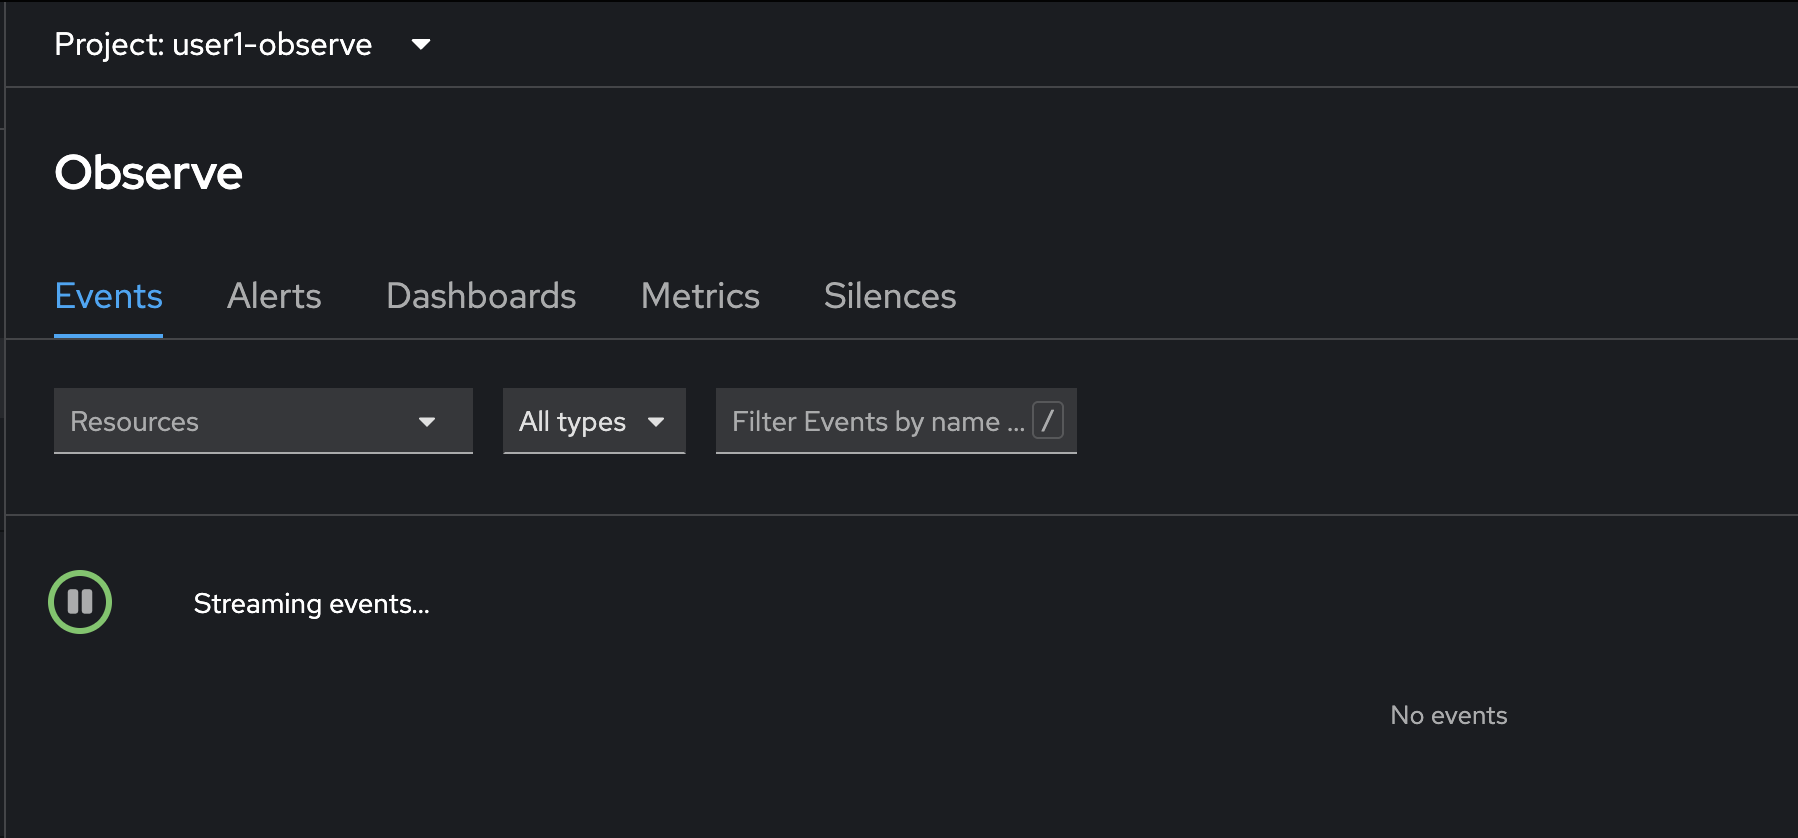
click Events Tab to view All event in this project or filter by resources.
Expose Metrics from Your Application
Developer can enable monitoring for user-defined projects in addition to the default platform monitoring. You can now monitor your own projects in OpenShift Container Platform without the need for an additional monitoring solution.
Review Application Code
-
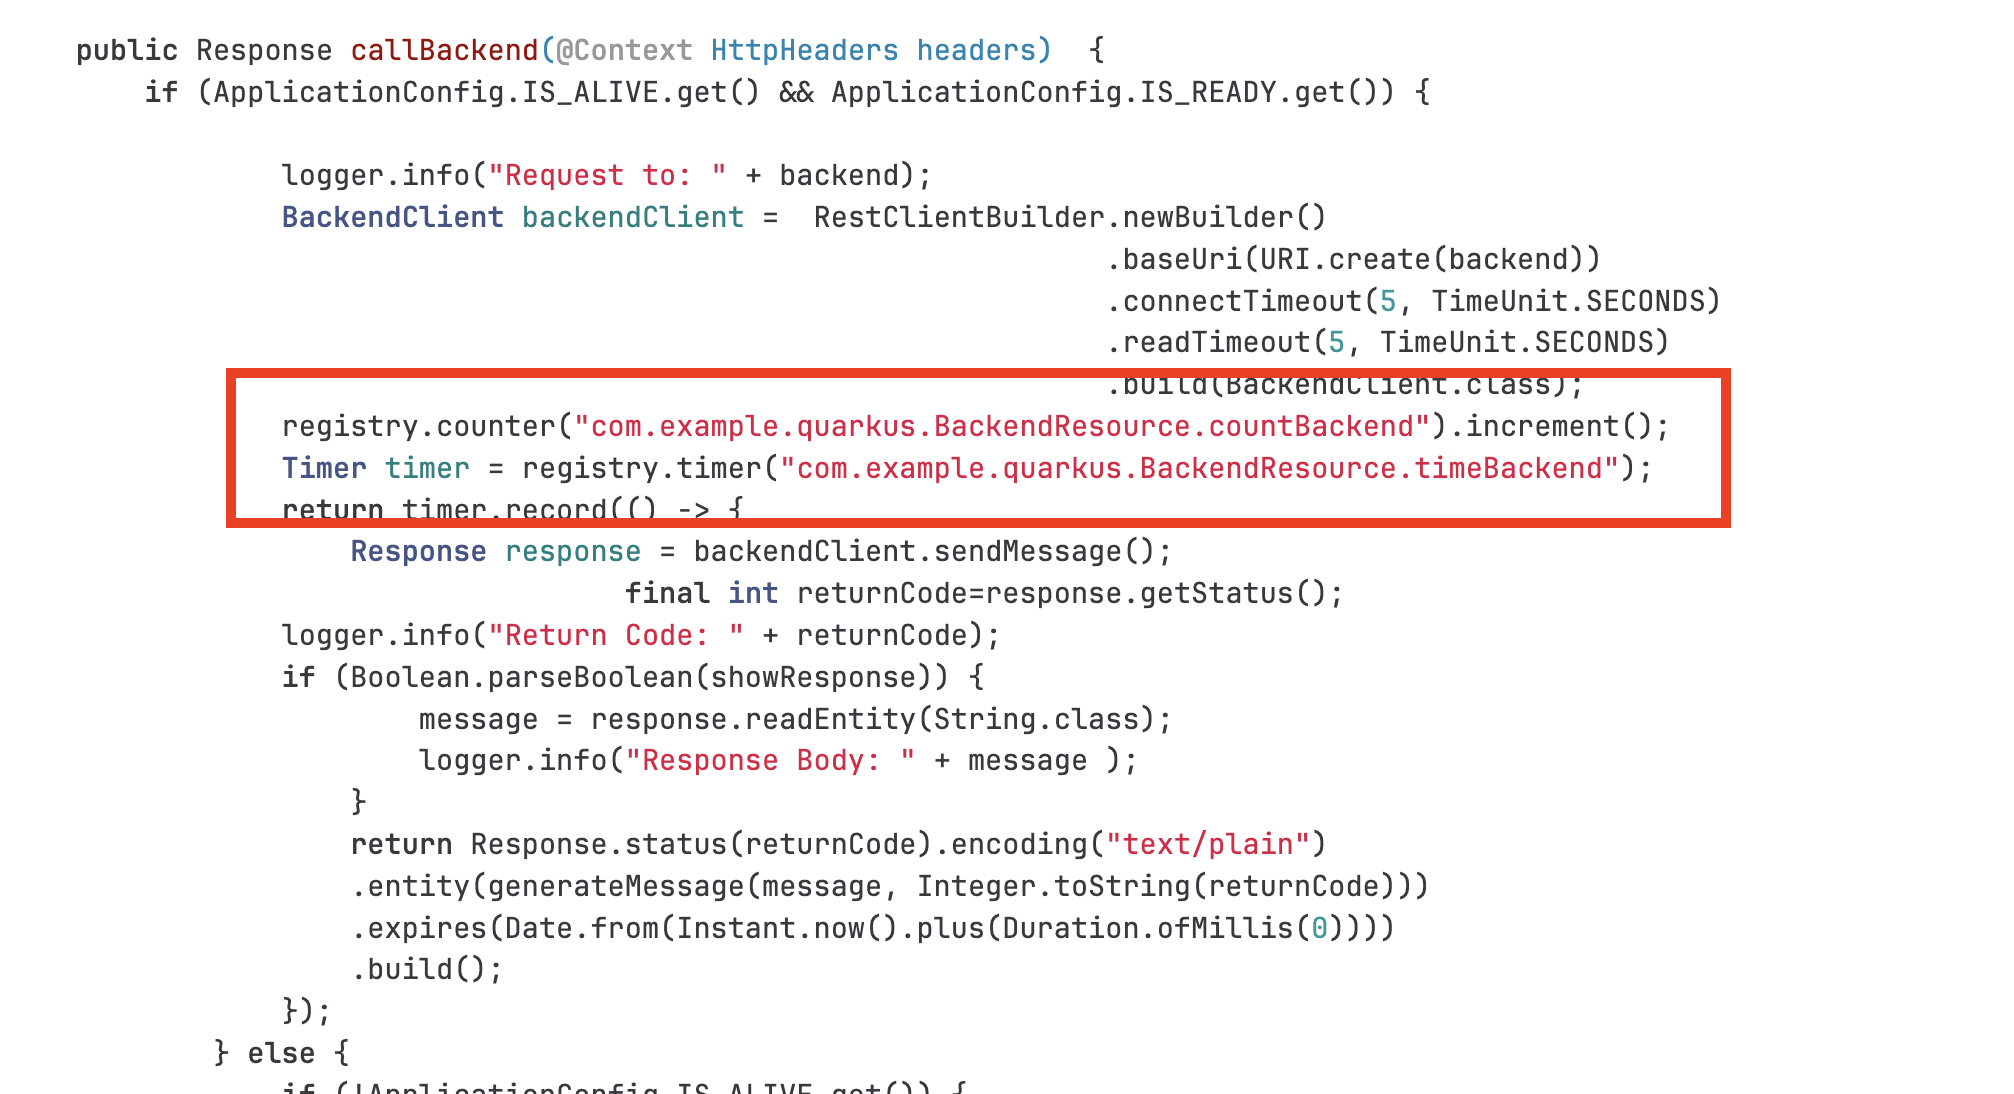
Review the
backendapplication source code. The application uses Quarkus Micrometer API inBackendResource.javafile to expose custom metrics from the application.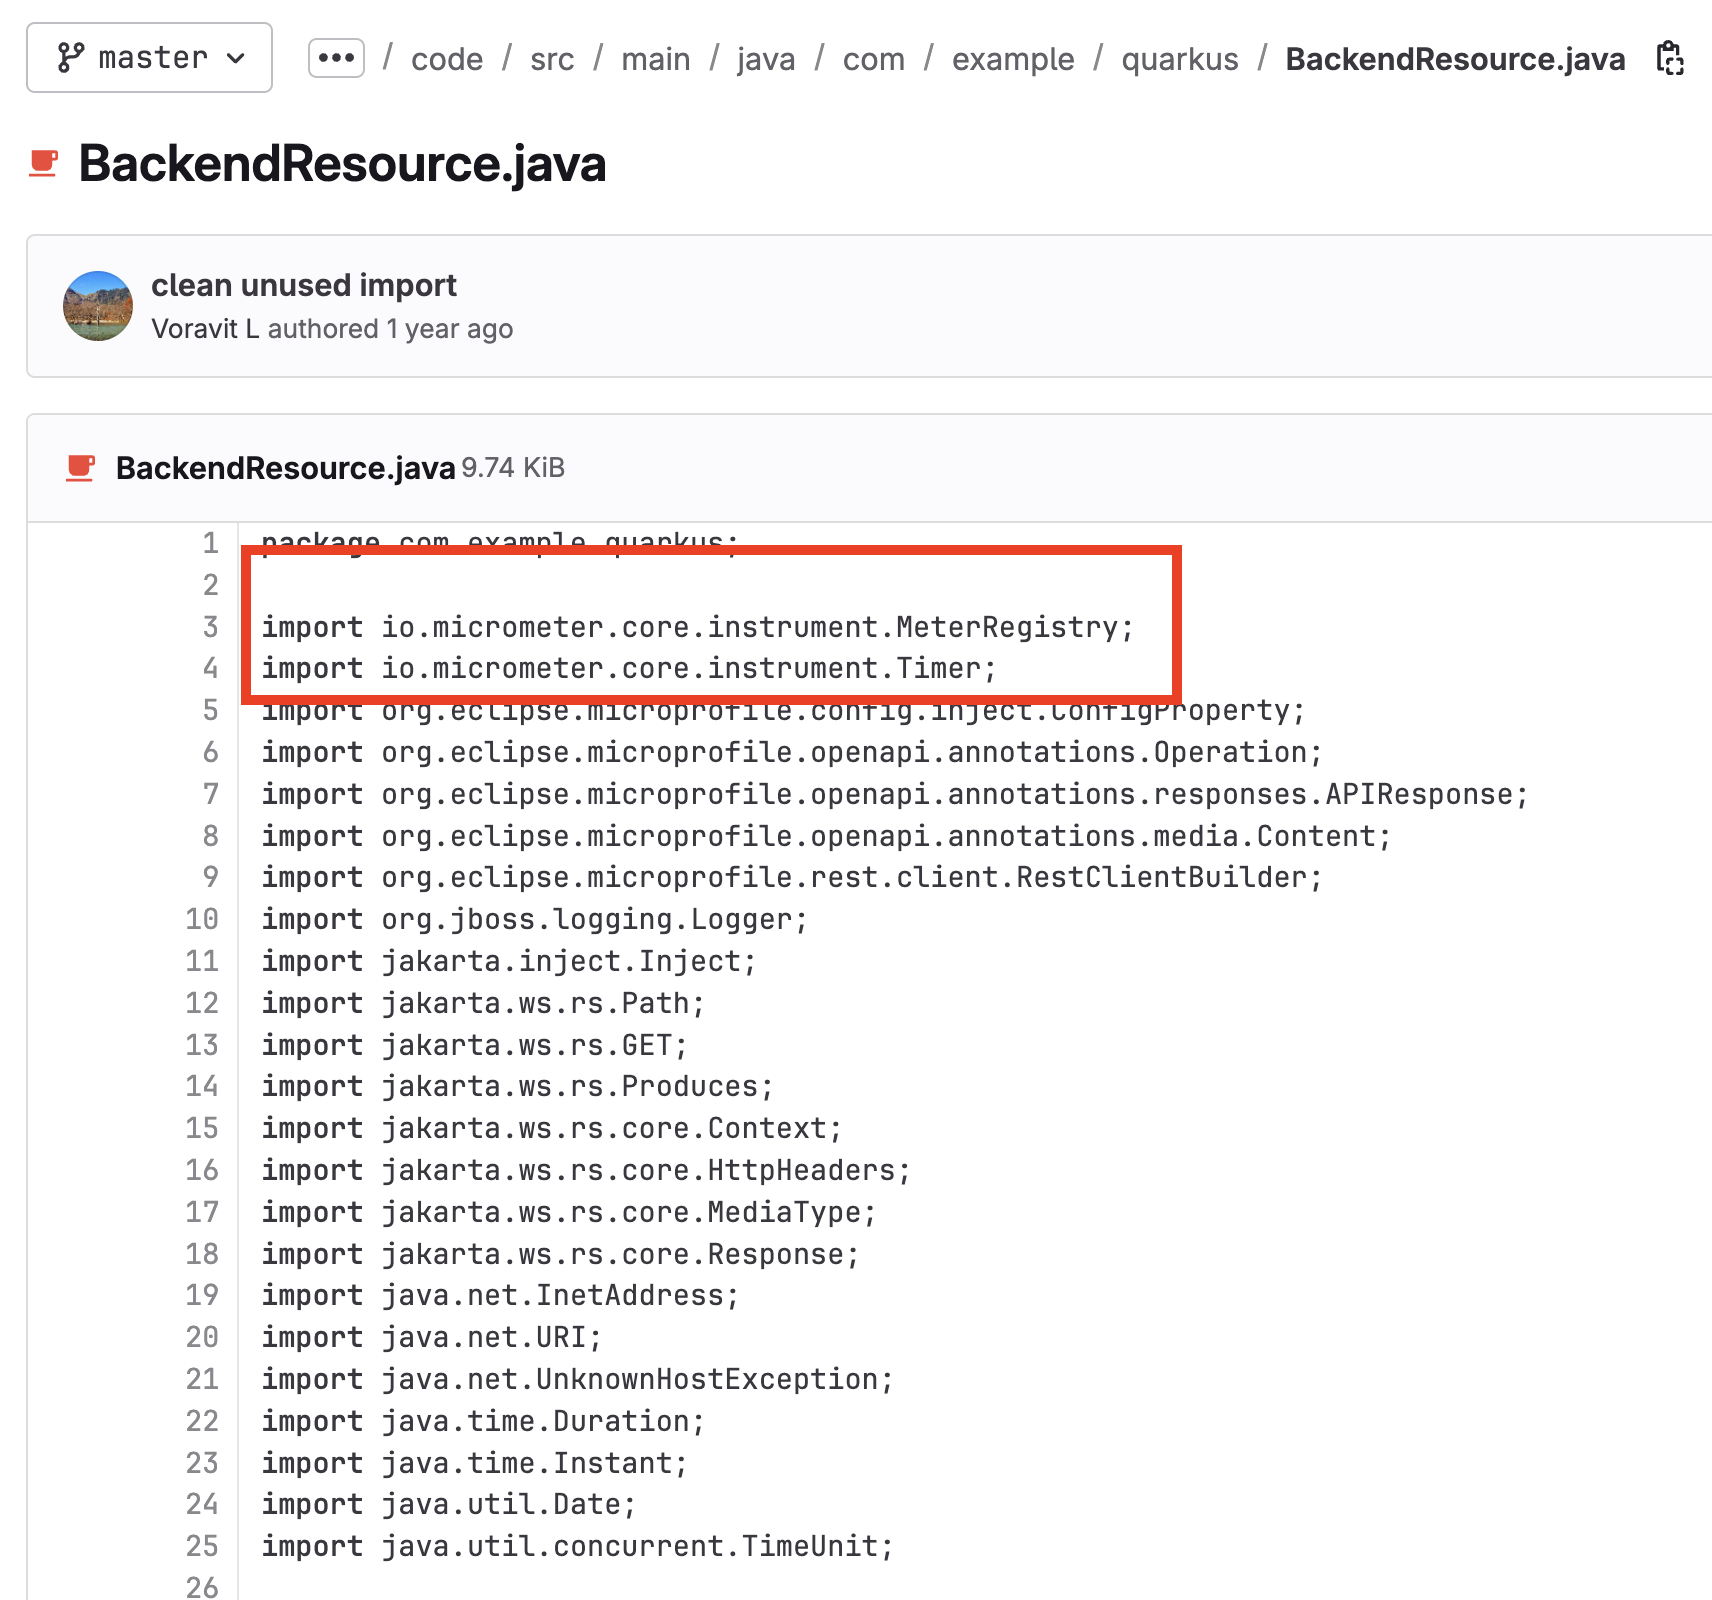
-
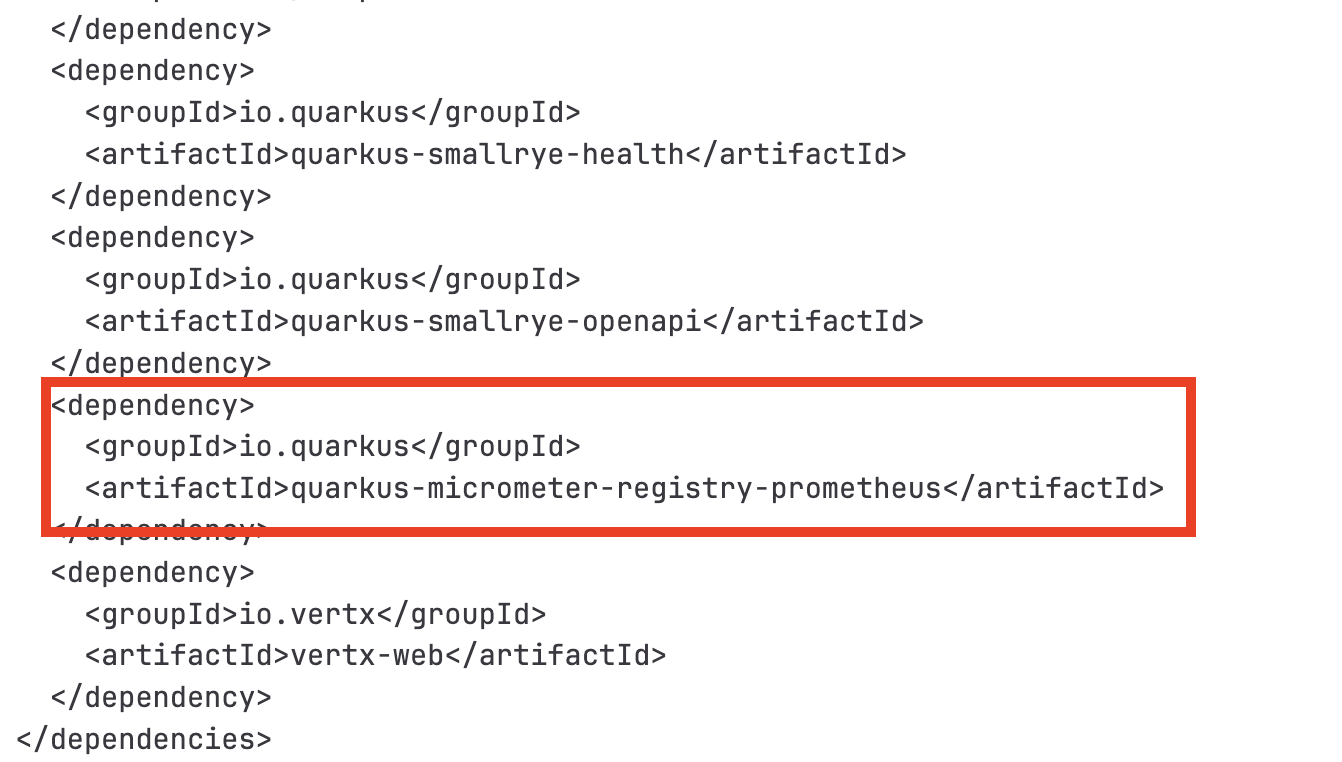
The Quarkus Micrometer library is included in
pom.xmlfile as the application’s dependency.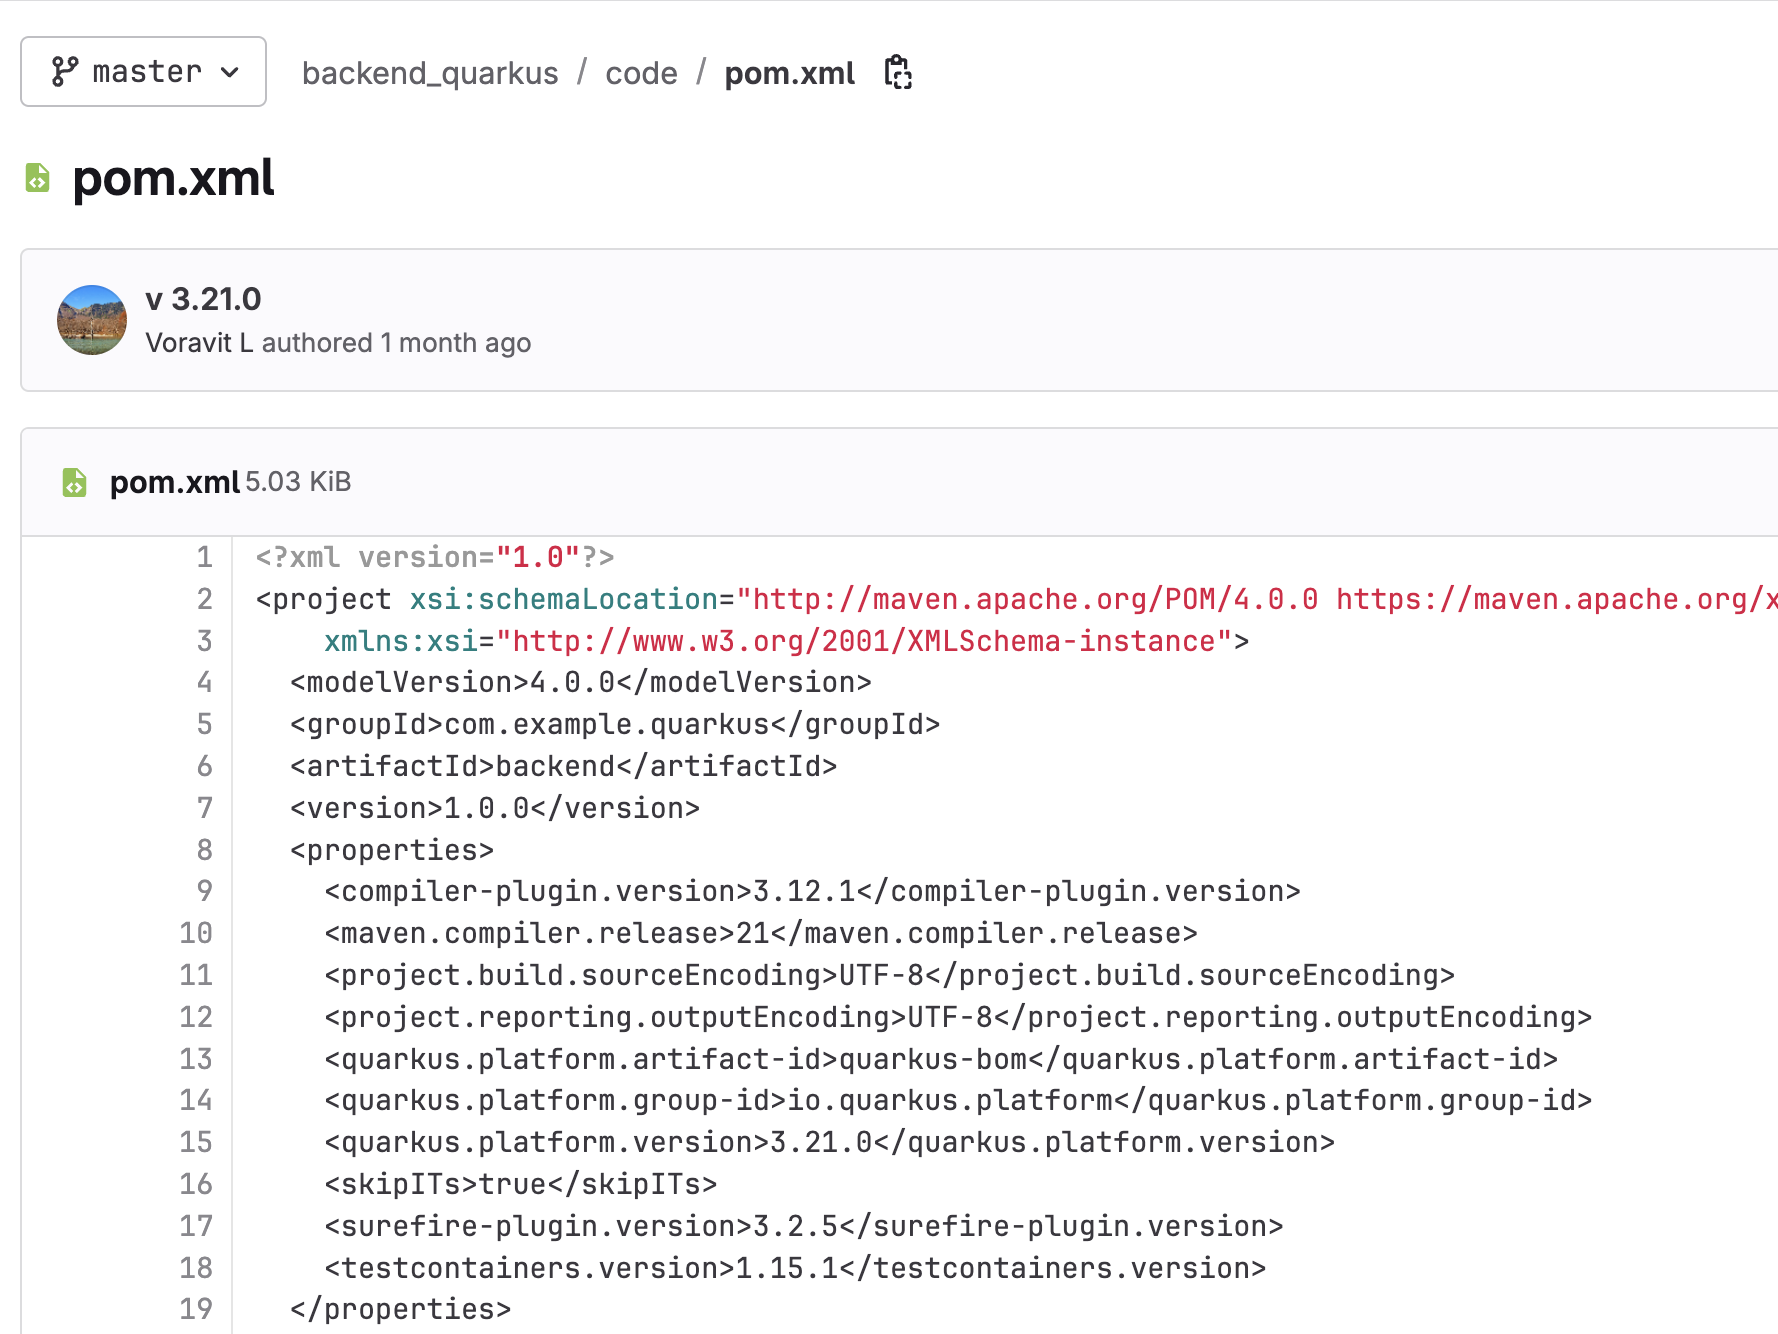
-
View Raw Application Metrics
-
In Topology view, select
backenddeployment, go to Resources tab in the right panel, then click on the application Pod.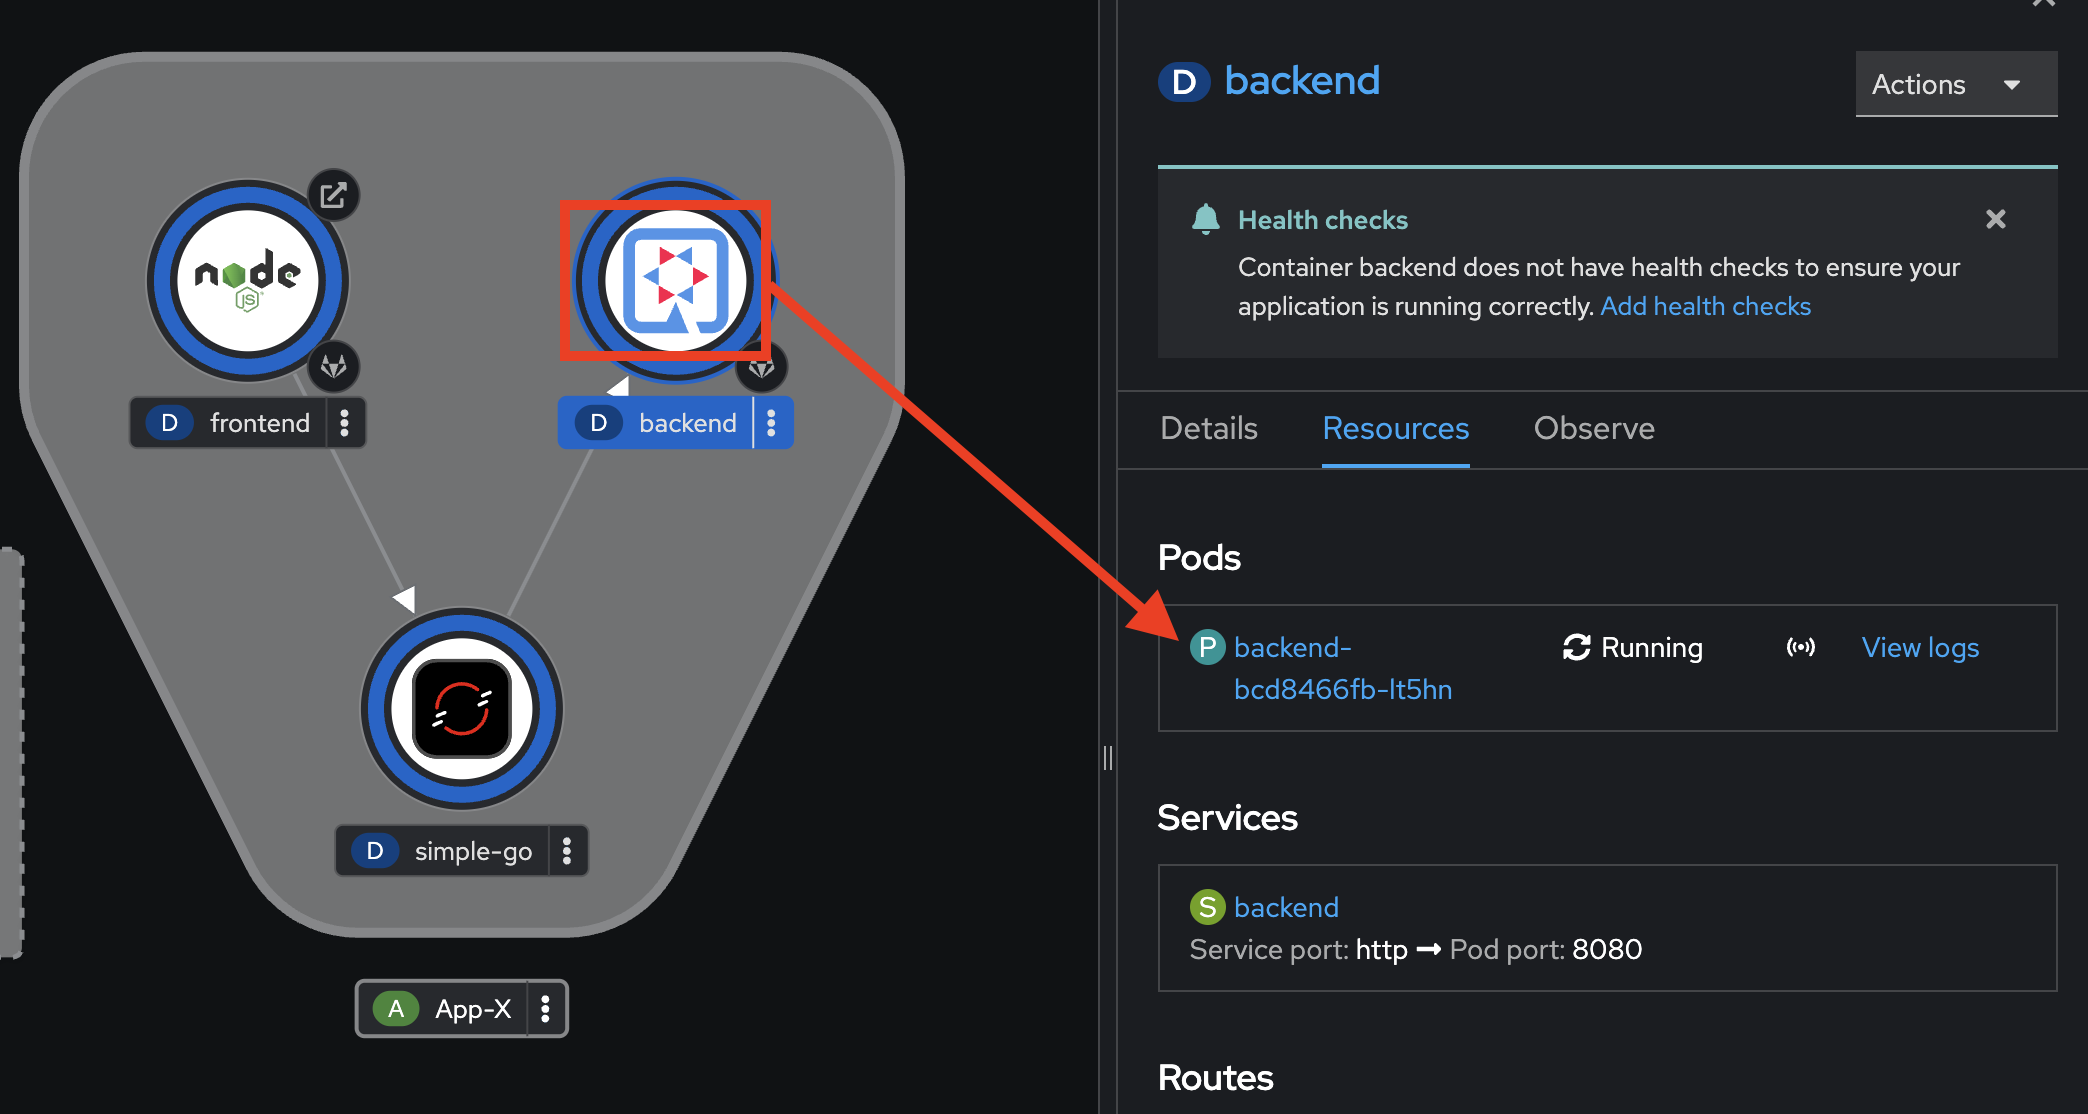
-
Go to Terminal tab, then run this command to see all metrics exposed from the application.
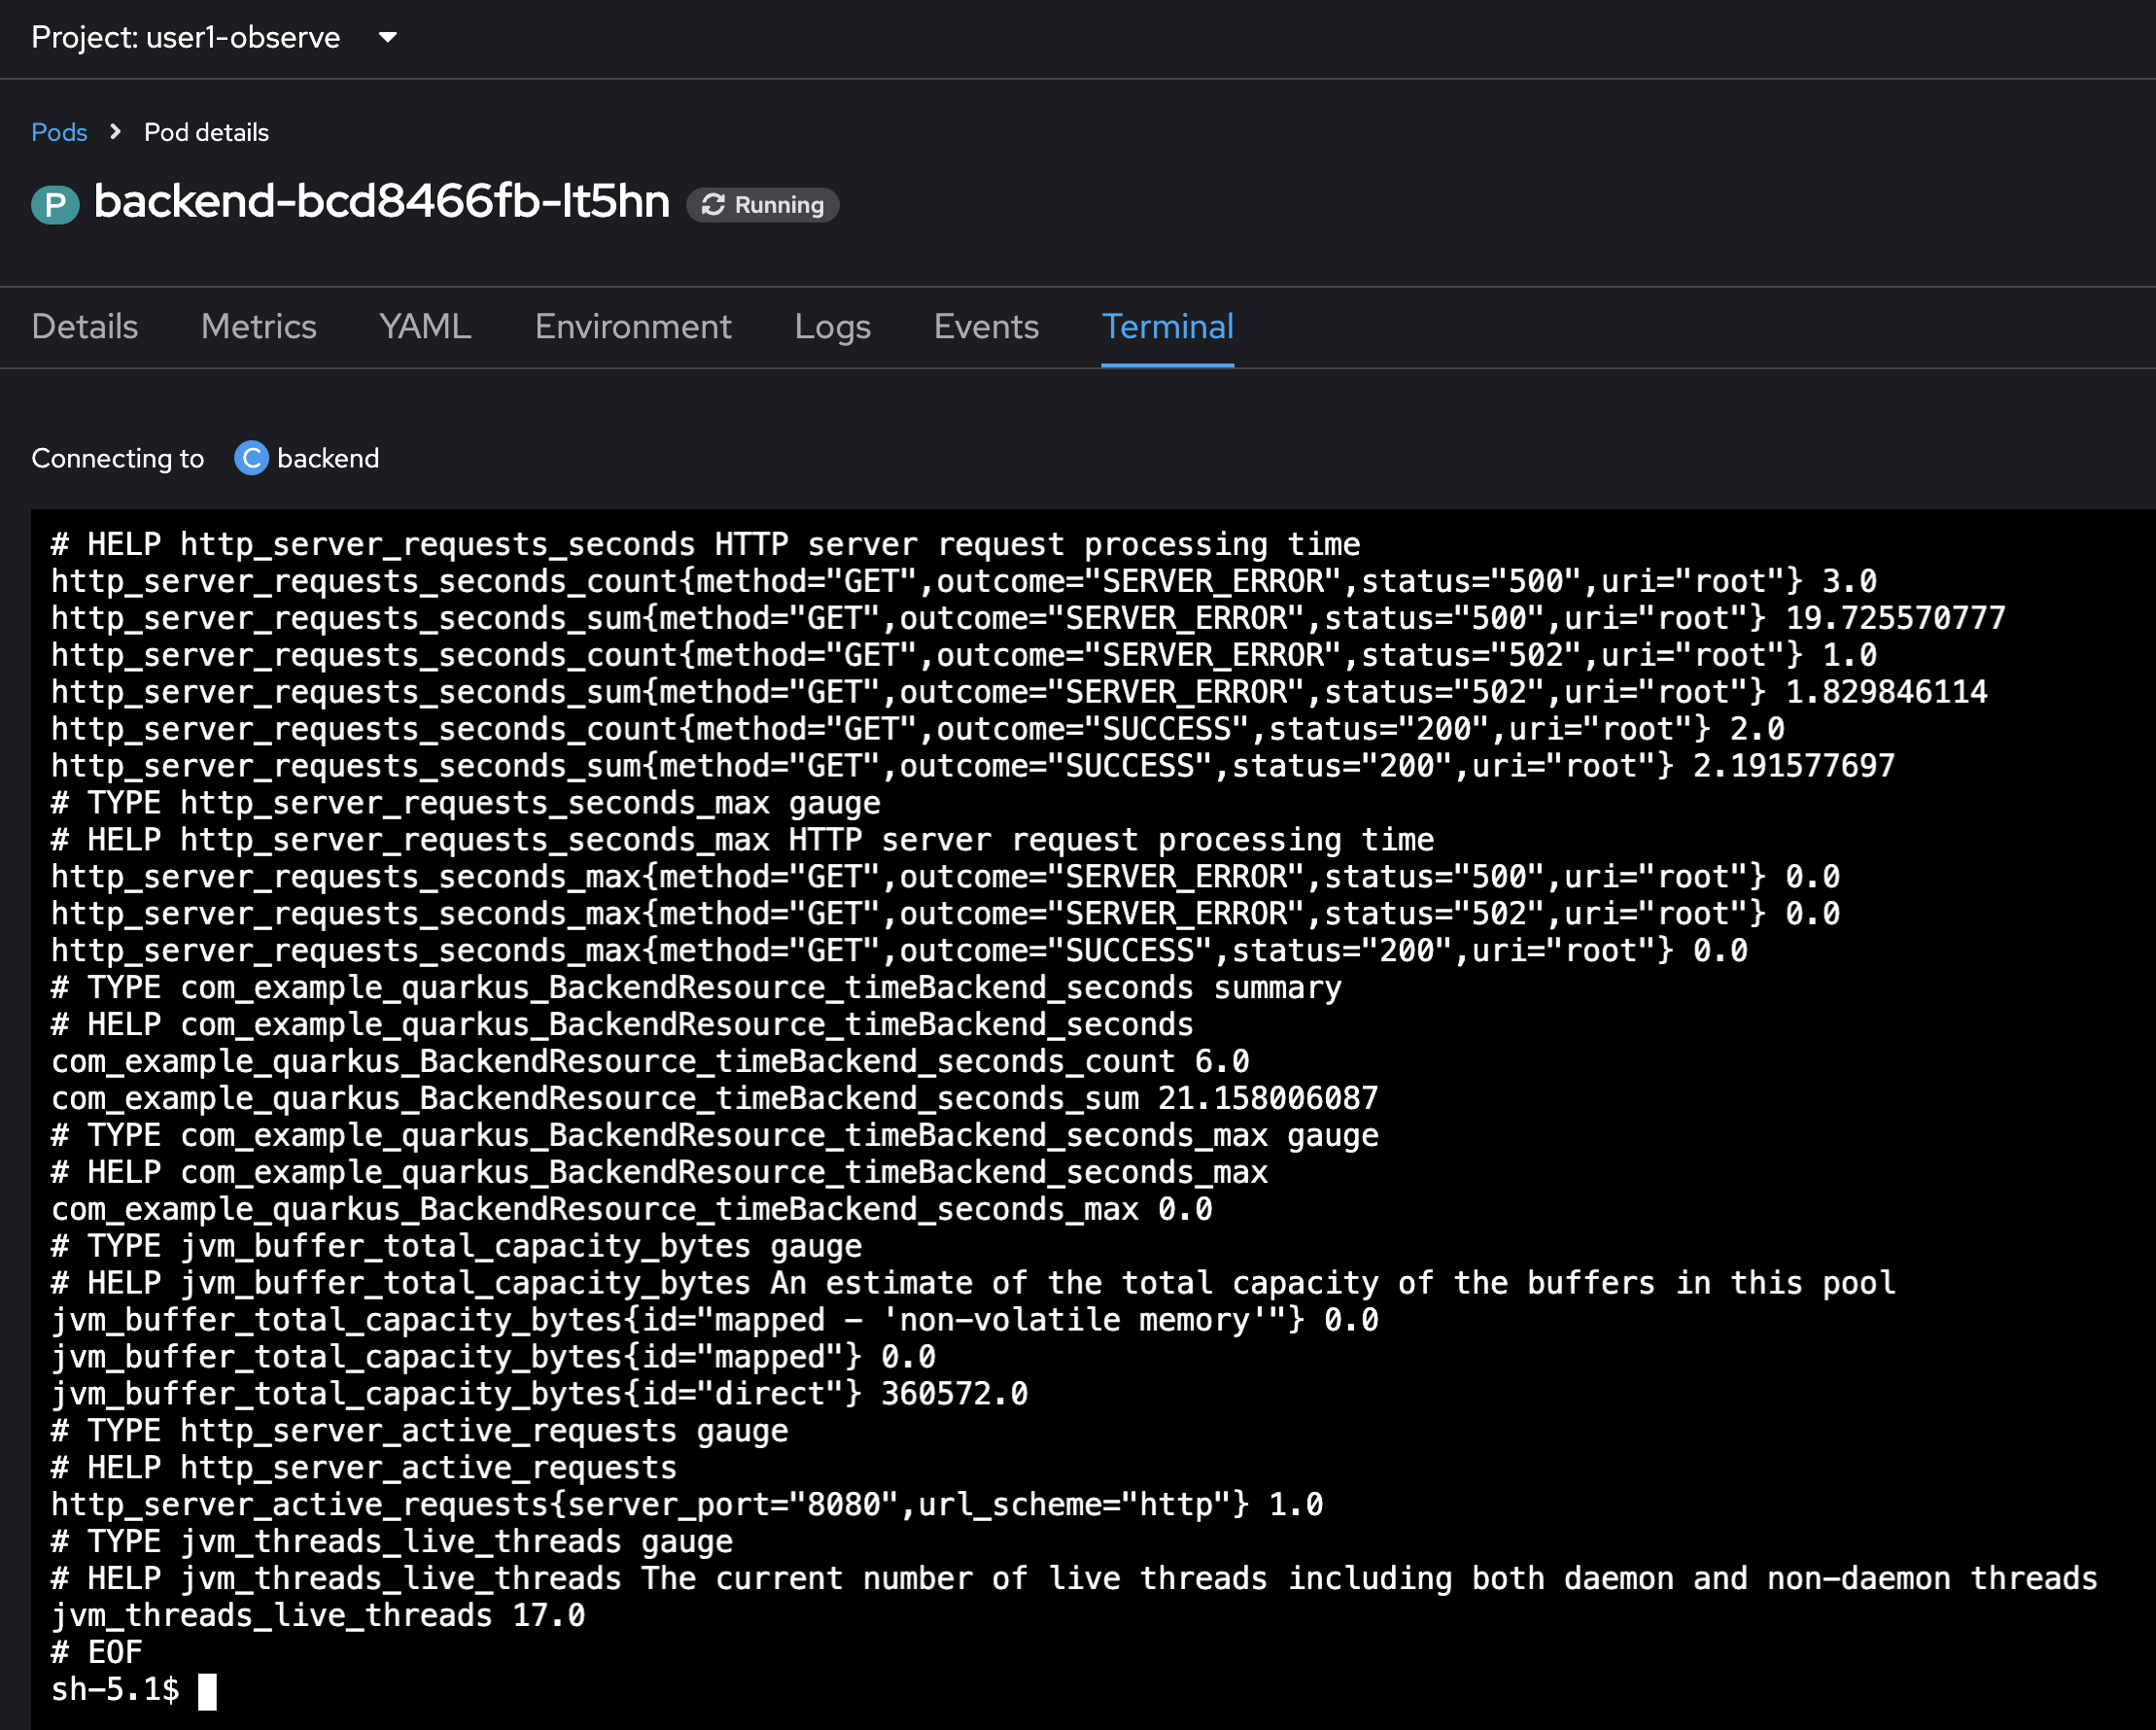
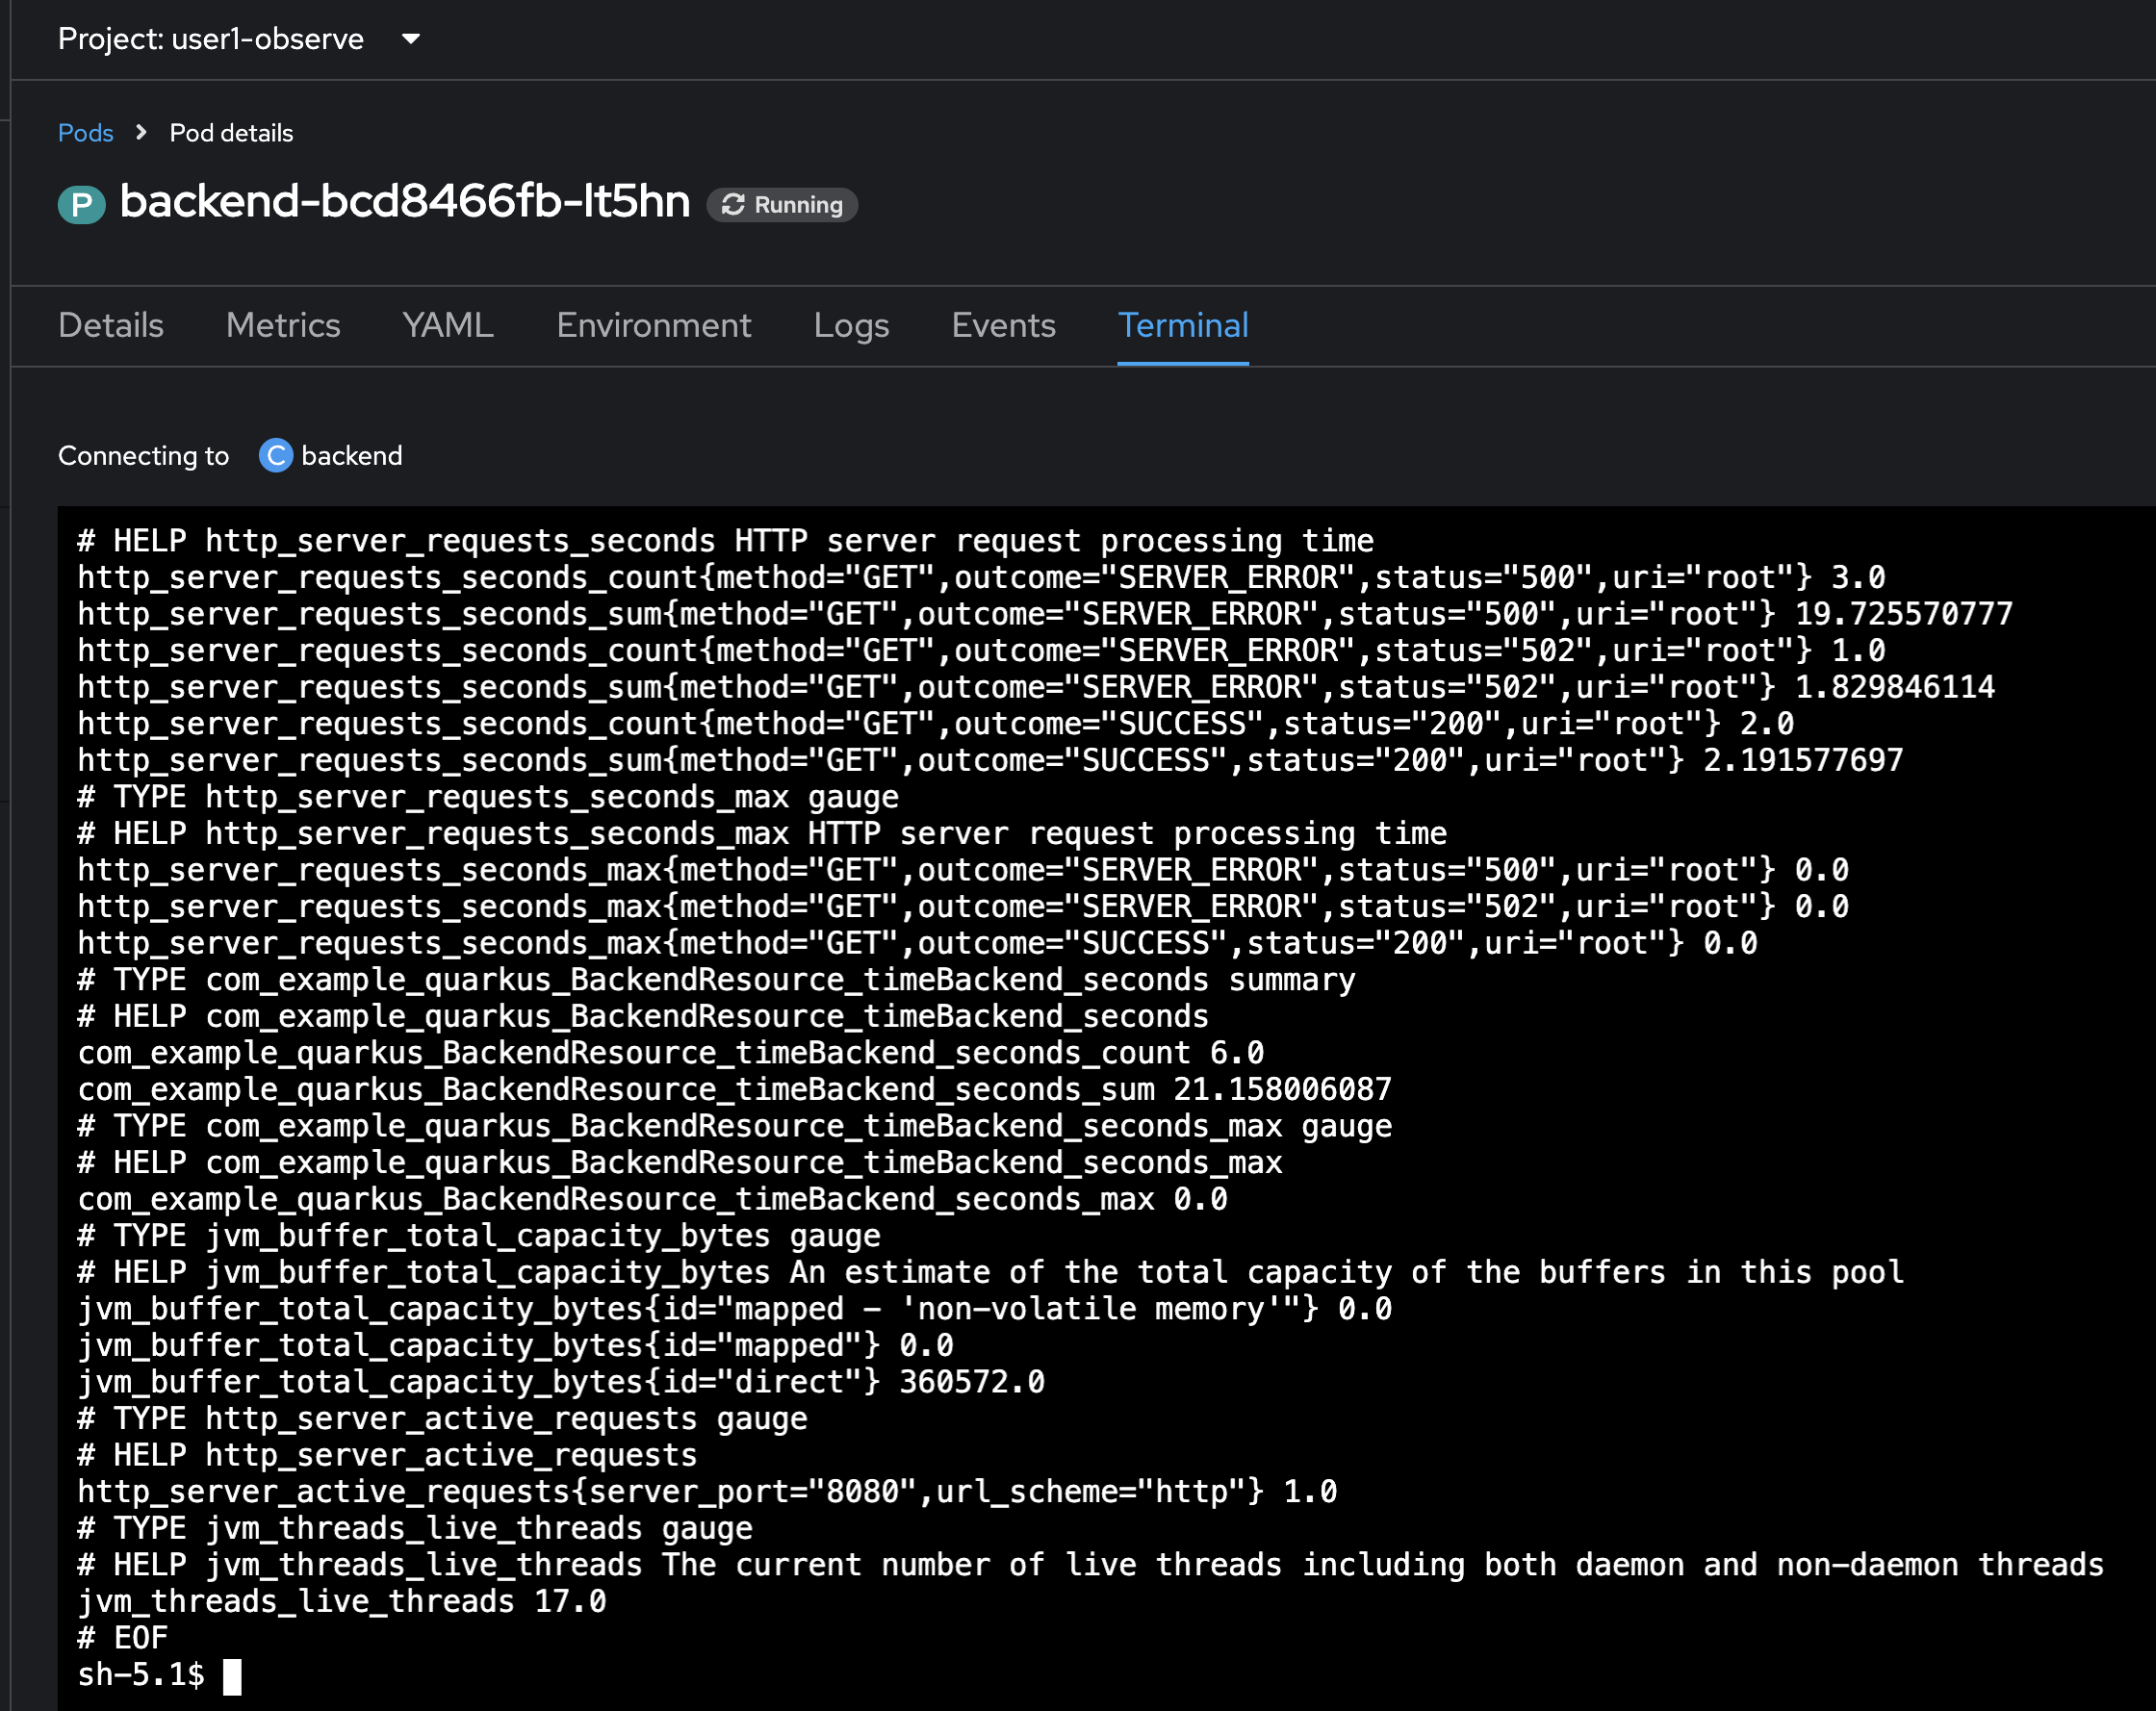
curl -s http://localhost:8080/q/metricsthe /q/metricsendpoint is automatically exposed from the application. This endpoint will be used by Prometheus to collect metrics from the application.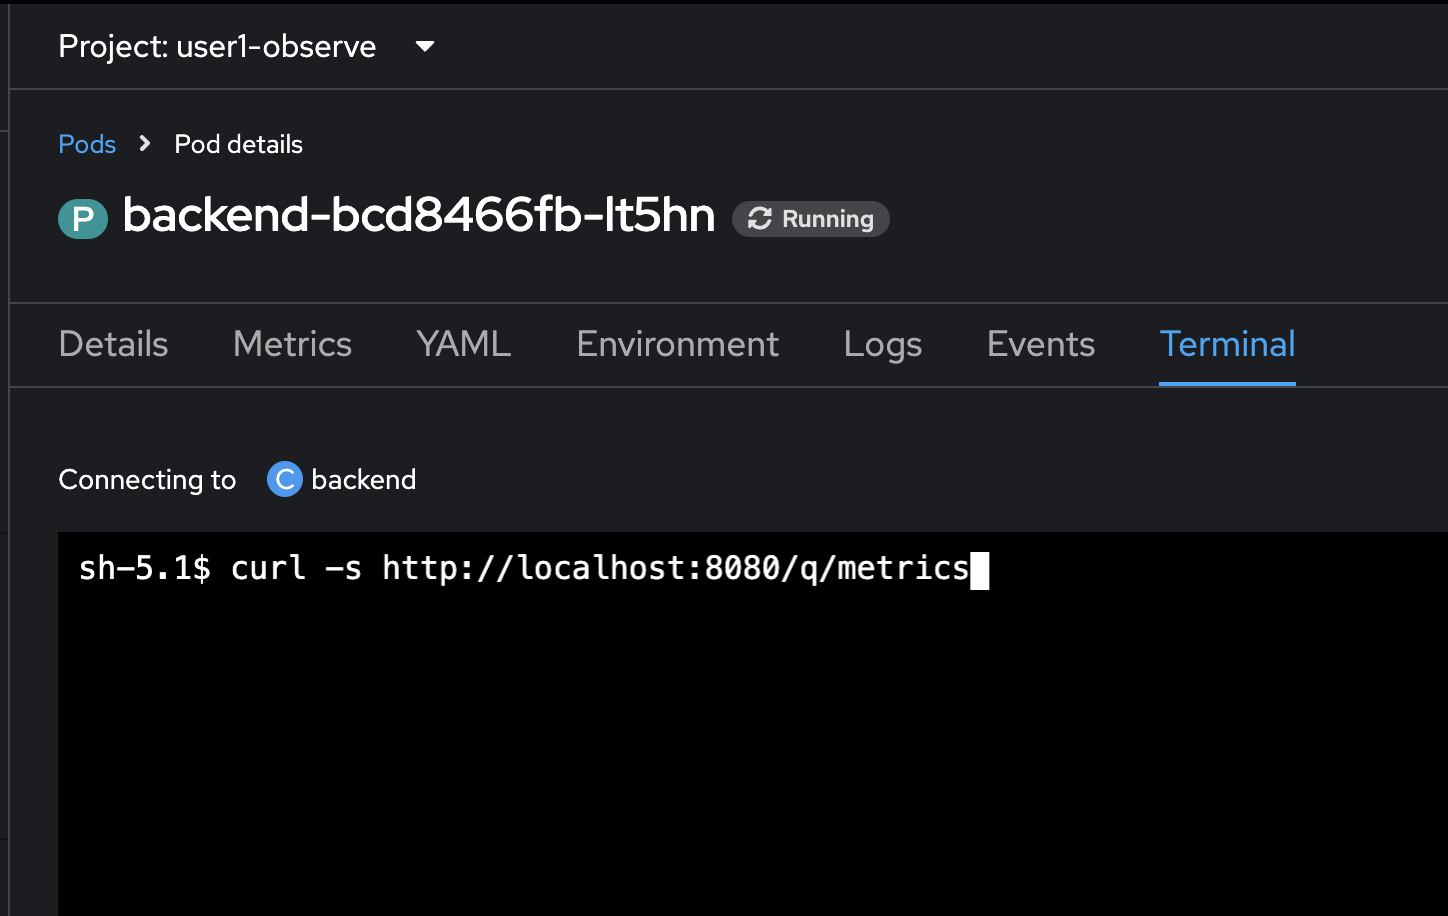
Sample result.
-
To view only application-specific metrics (including the custom metrics in the code you’ve reviewed), run this command in the Terminal tab. Then press
Ctrl + Fon keyboard and search forBackendResourcemetrics. These are custom metrics defined in the code ofBackendResource.javafile.curl -s http://localhost:8080/q/metrics/applicationexample result
-
/q/metrics: This endpoint provides a general overview of Quarkus’s internal metrics, such as CPU usage, memory consumption, and garbage collection statistics. It’s useful for monitoring the health and performance of the Quarkus runtime itself. -
/q/metrics/application: This endpoint exposes metrics that you’ve specifically defined in your Quarkus application using the Micrometer library. Micrometer is a facade that allows you to easily collect metrics that can be exported to various monitoring systems like Prometheus. You can use Micrometer to create custom metrics like counters, gauges, and timers to track various aspects of your application’s behavior.
-
Monitor Application with Custom Metrics
Now our backend application has exposed metrics including our custom metrics defined in the code of BackendResource.java file. In the previous topic we’ve seen how to get all metrics from the URL exposed by the application.
However, in practice, we won’t use curl command to query metrics but we’re going to use OpenShift console to query the metrics with PromQL just like we’ve done before.
Though those metrics exposed from the backend application haven’t been collected by Prometheus yet. So, we have to configure Prometheus to know our application and from which URL it should use to collect the metrics. To do that we have to create a ServiceMonitor object.
-
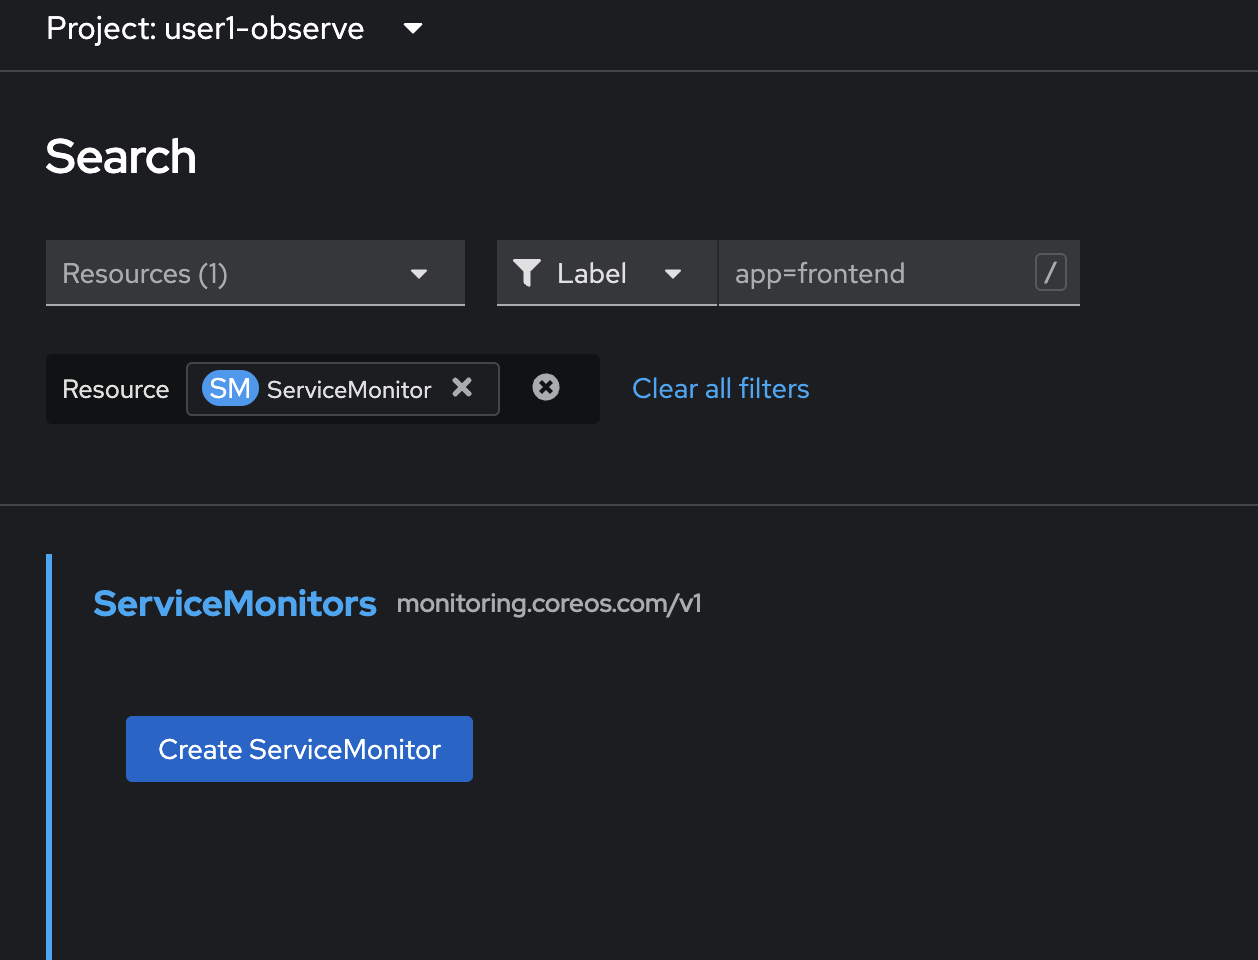
In OpenShift console, click on Search menu on the left, then enter
servicemonitorto the Resource dorpdownlist, and then select SM ServiceMonitor from the list.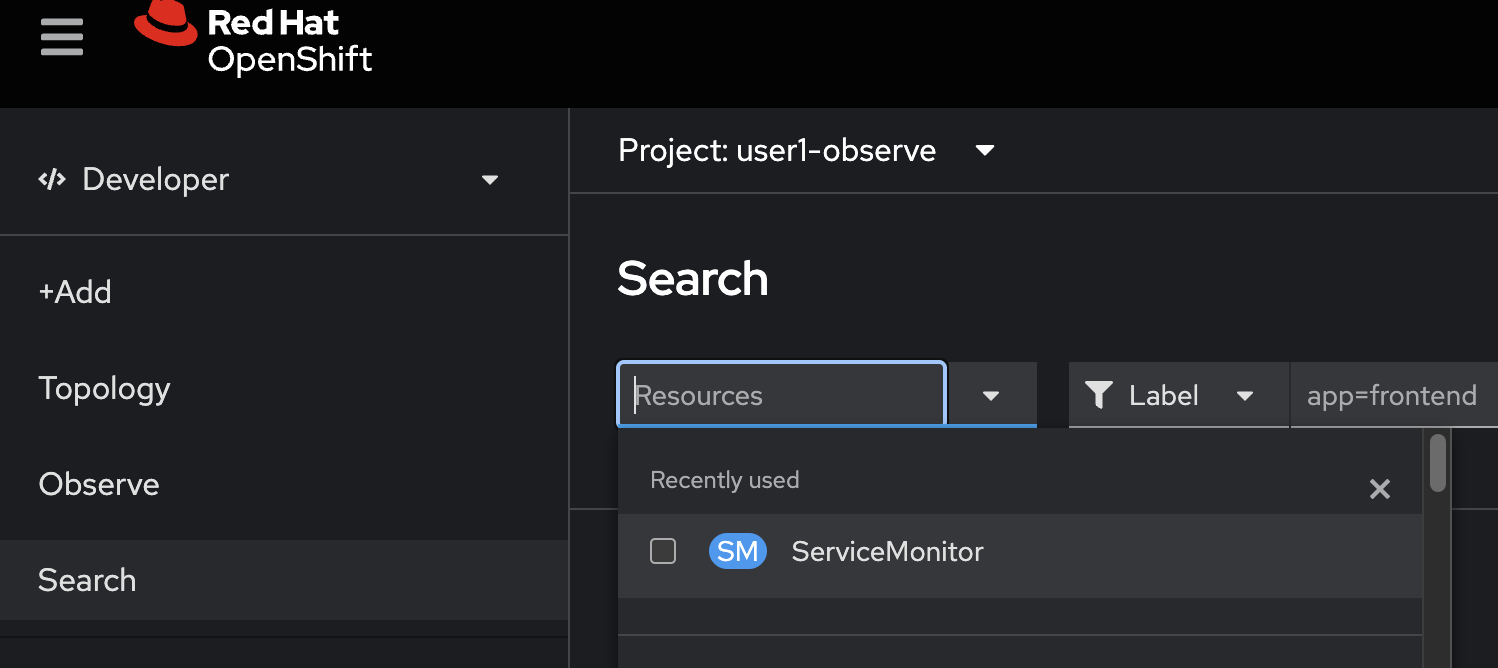
-
Click Create ServiceMonitor button.
-
Delete all YAML code in the YAML editor. Copy this YAML from the code snippet below and paste to the YAML editor in OpenShift console. Then click Create button.
You can see that we’ve specified the /q/metricsand/q/metrics/applicationendpoint in thepathfield. So Prometheus will know what endpoint it should call to collect metrics.apiVersion: monitoring.coreos.com/v1 kind: ServiceMonitor metadata: labels: k8s-app: backend-monitor name: backend-monitor spec: endpoints: - interval: 30s port: http path: /q/metrics scheme: http - interval: 30s port: http path: /q/metrics/application scheme: http selector: matchLabels: app: backend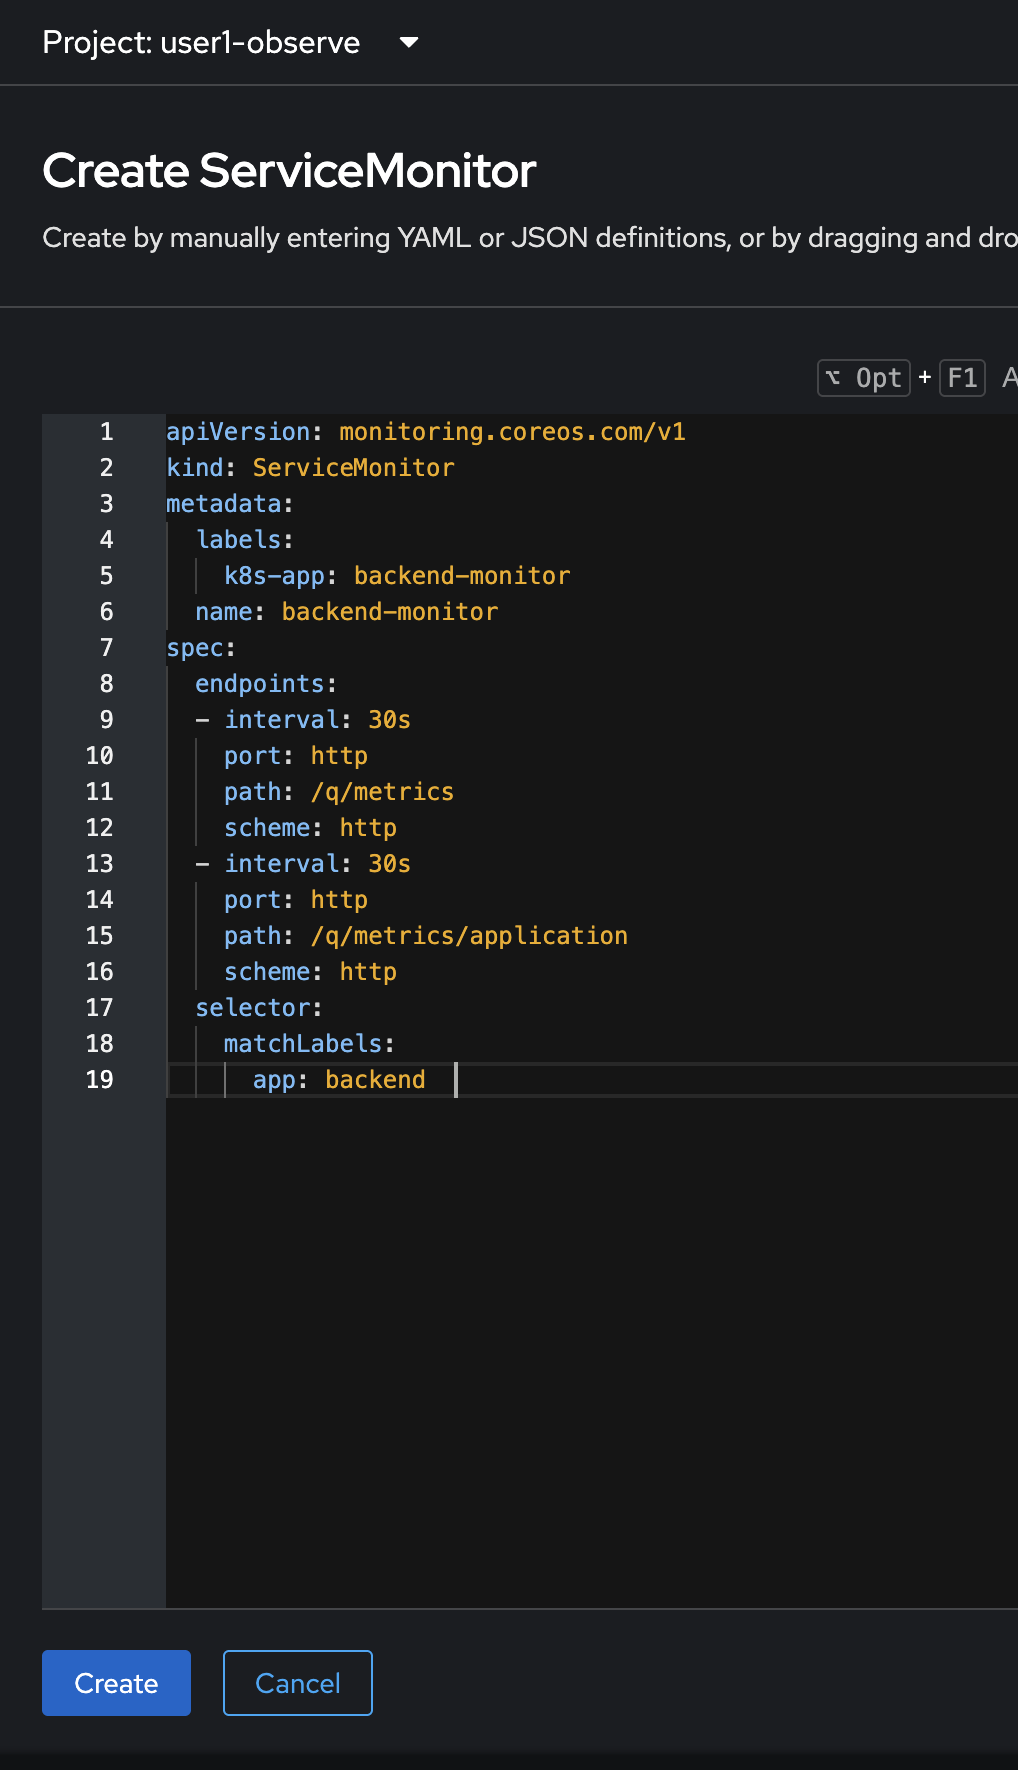
-
The
ServiceMonitorresource should be created. Click YAML tab to view YAML configuration.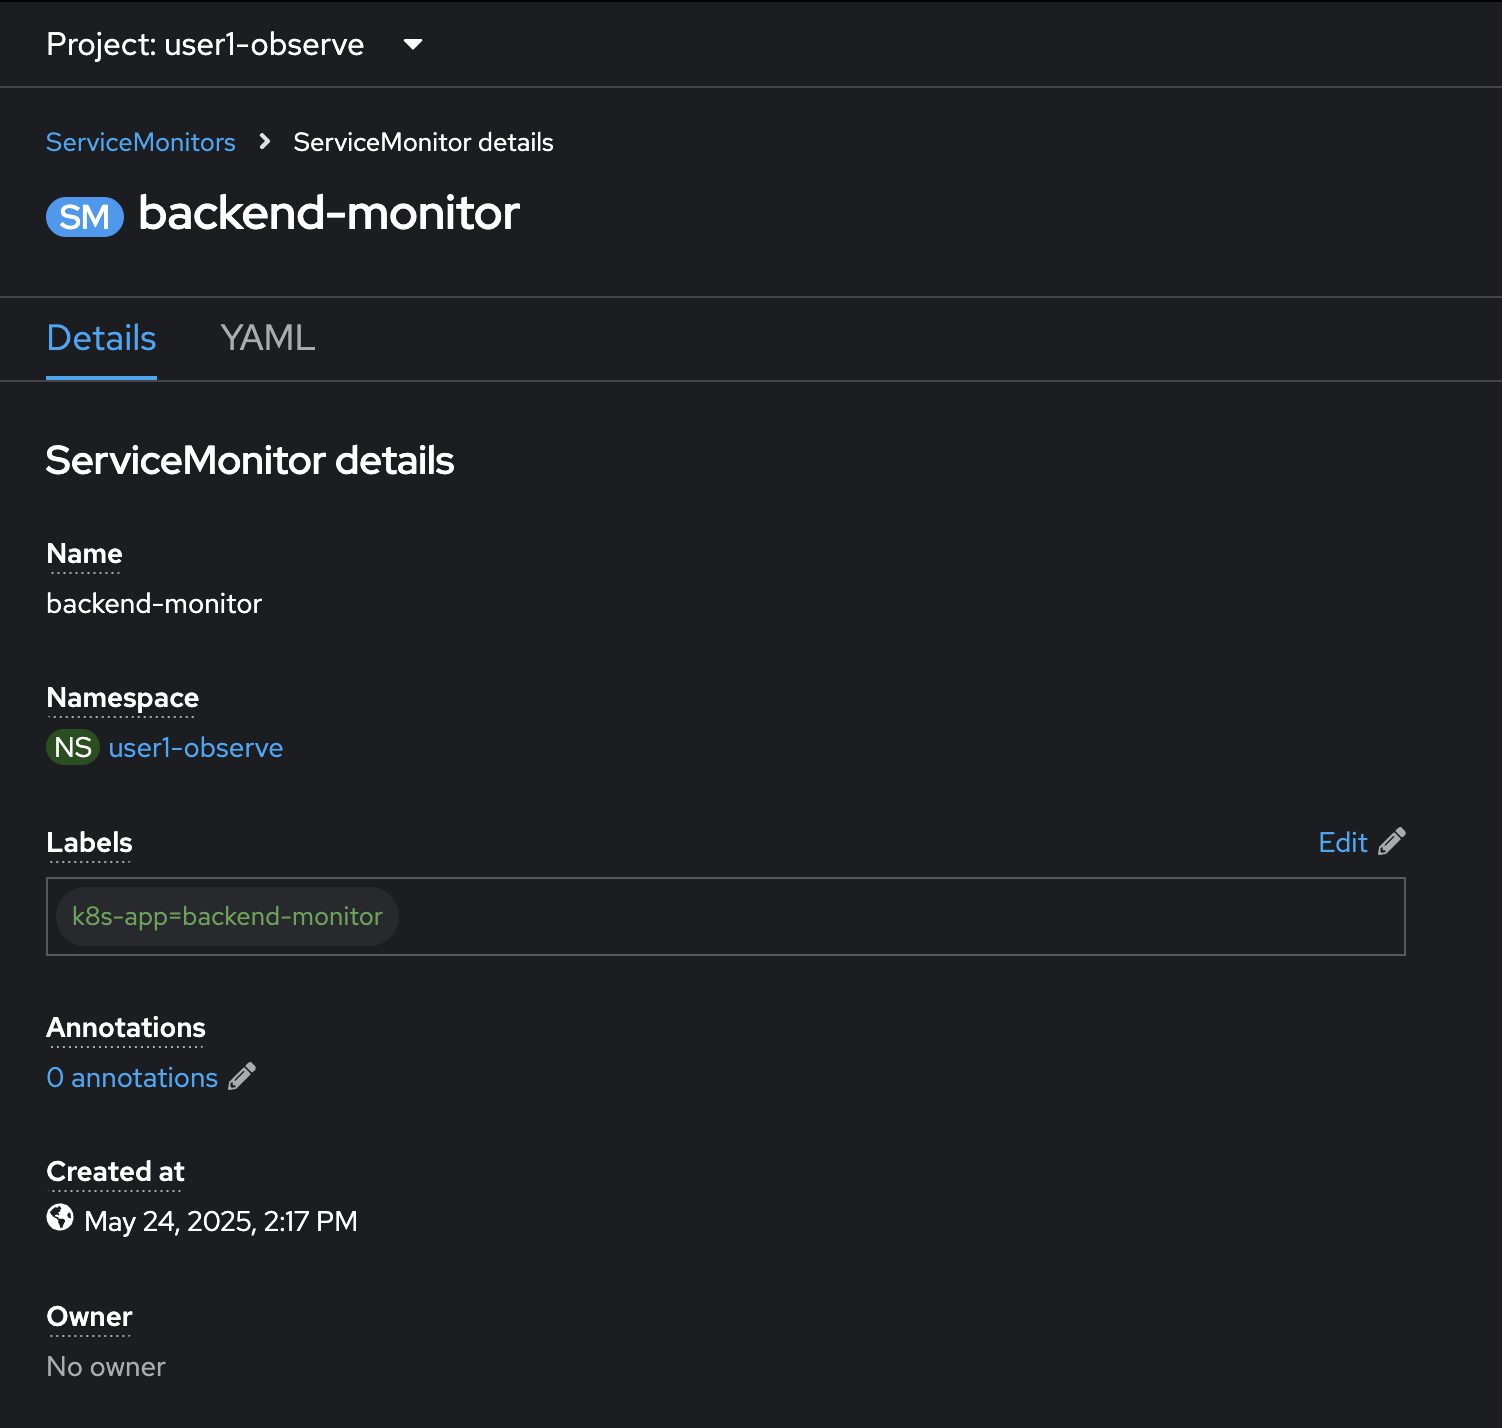
-
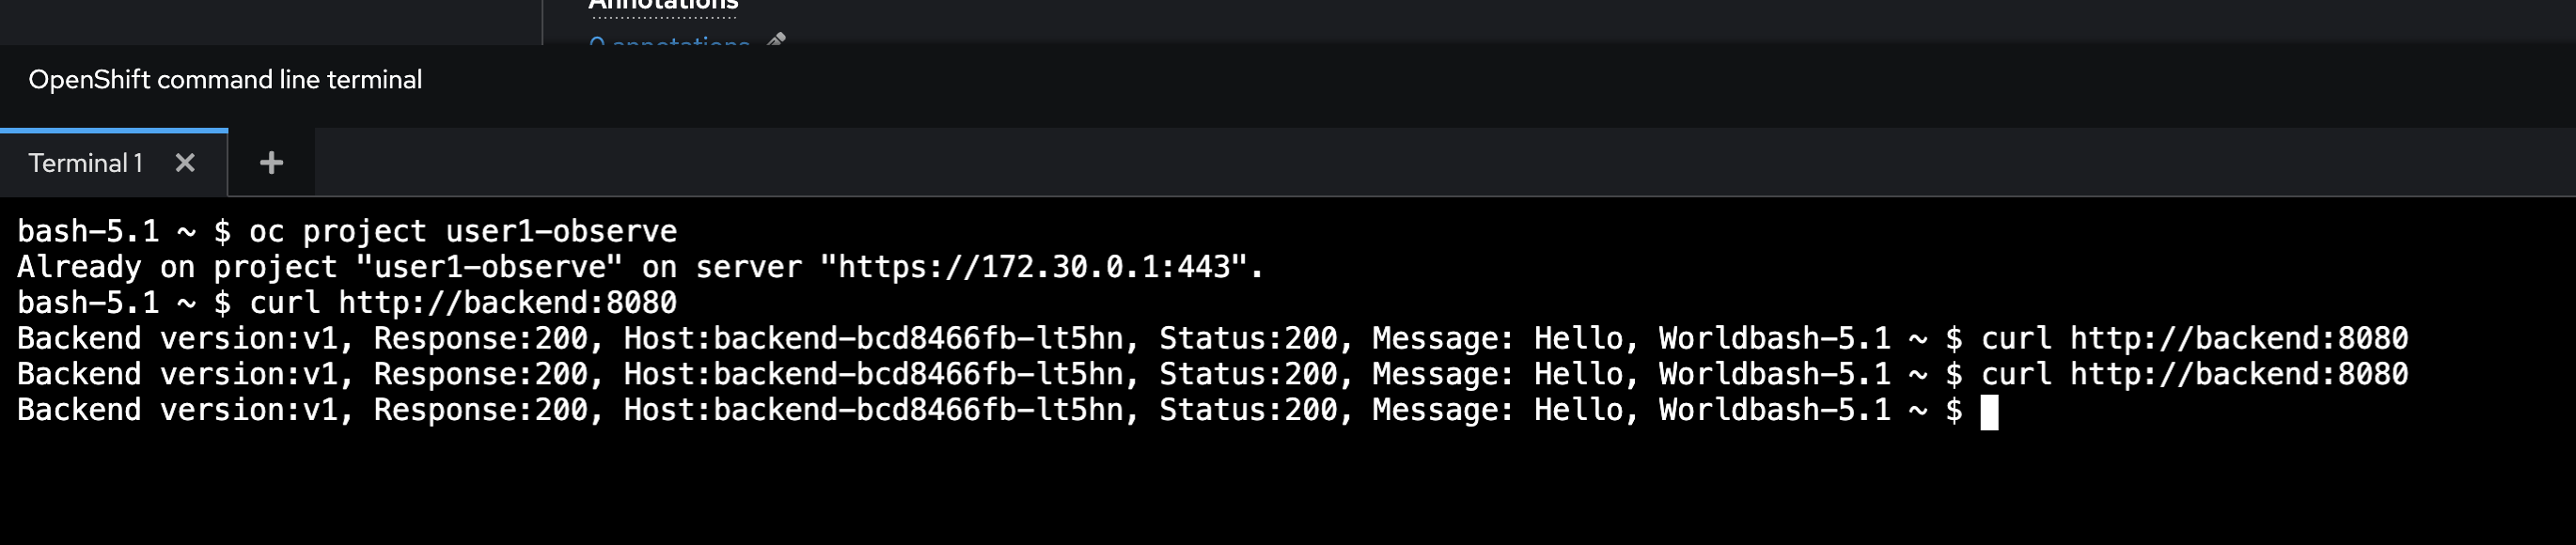
Open the web terminal and run following command to test API calls in
backendapplication 2-3 times. Some custom metric values will be geneated based on these API calls.Don’t forget to change userXin the command to match to your username.oc project userX-observe curl http://backend.userX-observe.svc.cluster.local:8080Sample output.
-
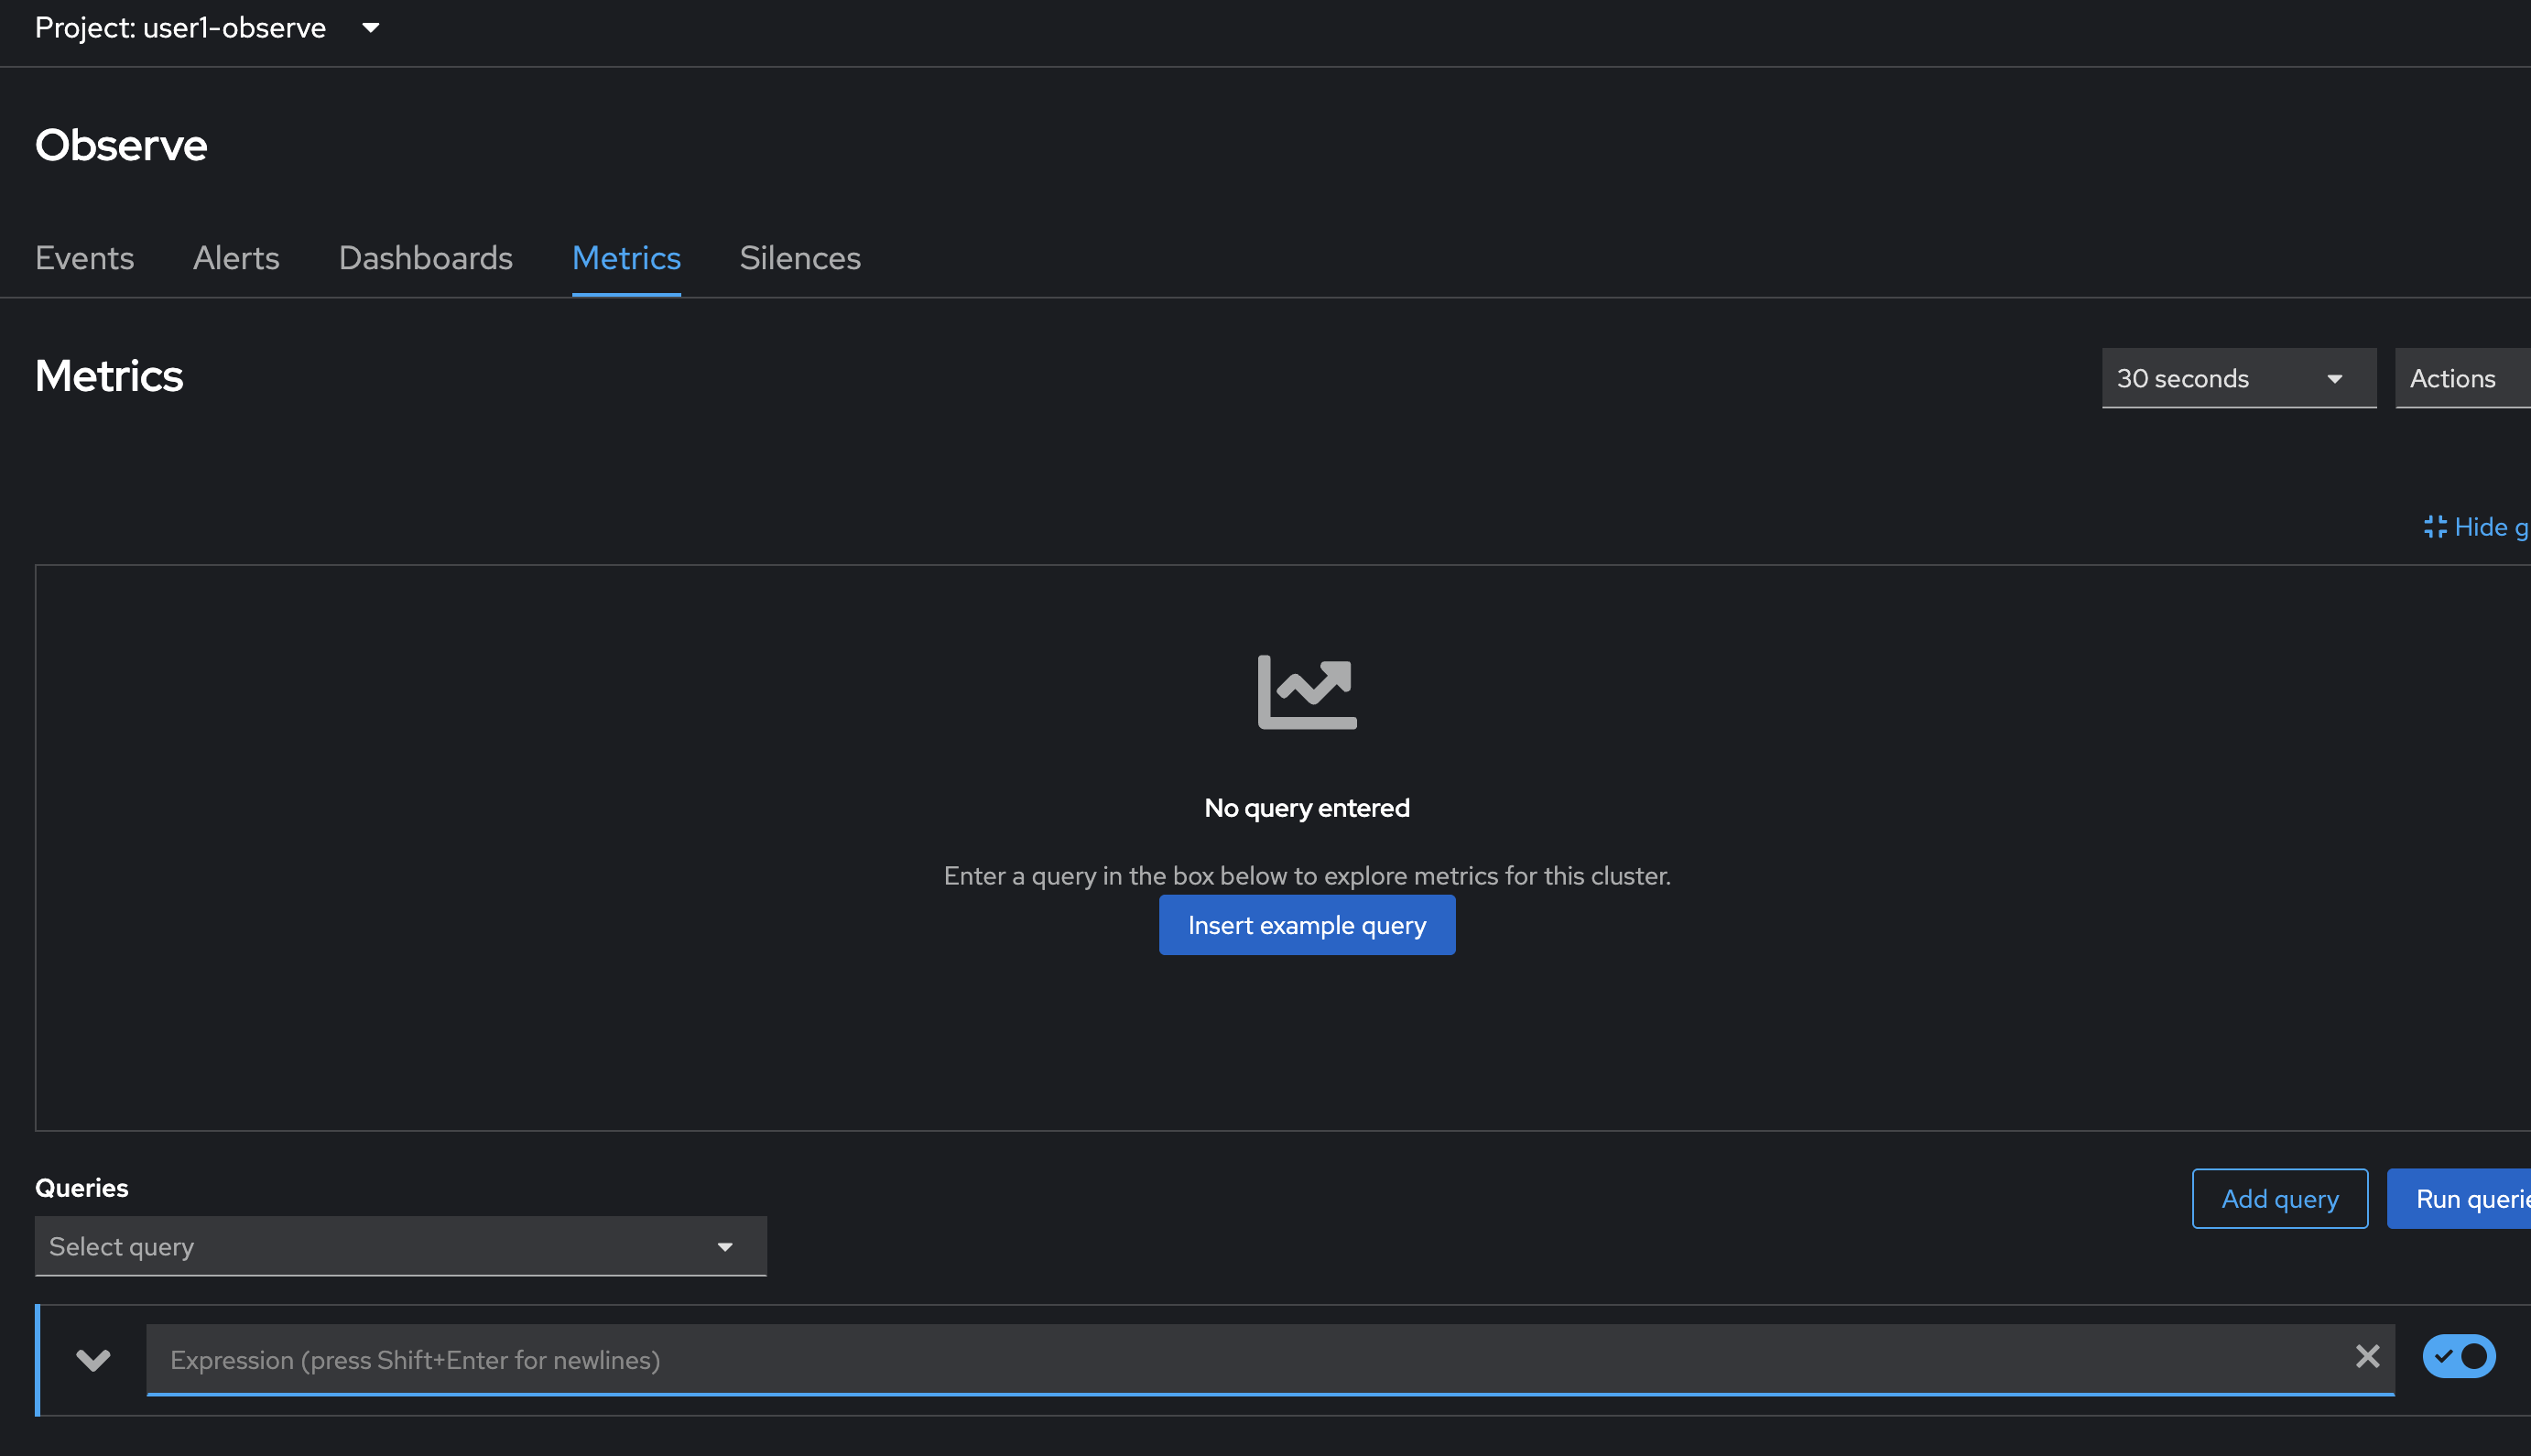
Next try to query the custom metrics. Click on Observe menu on the left, then select Metrics tab.
-
Enter
comto the Expression input and wait for auto suggesstion.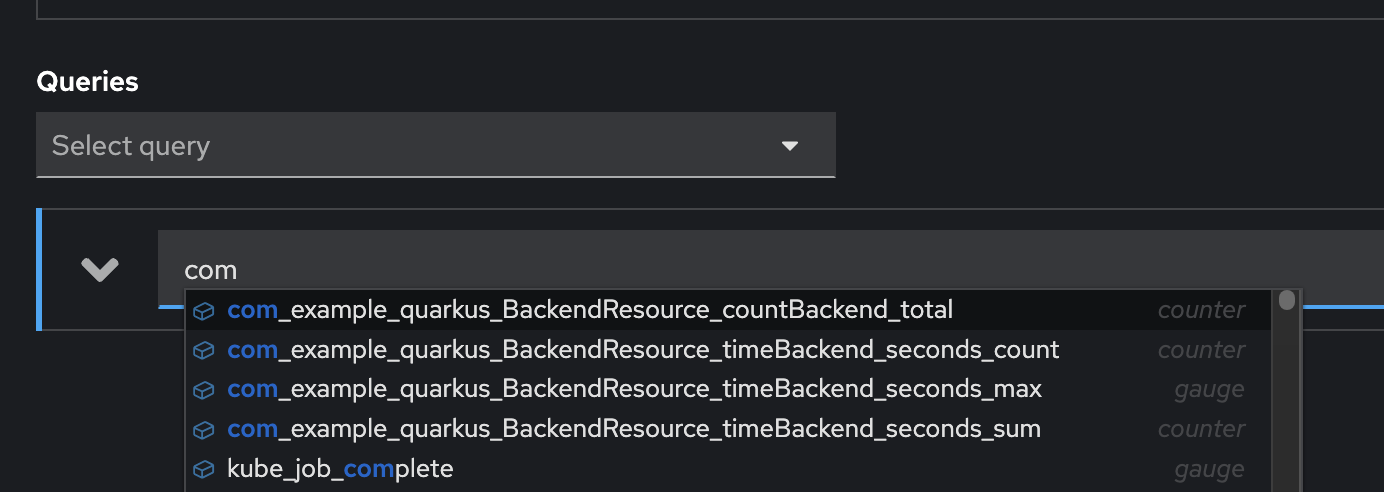
If you don’t see any metrics started with comin auto suggession, this is because the Prometheus hasn’t collect metrics from the application yet. So, just wait for a few minutes and try again. -
Select
com_example_quarkus_BackendResource_countBackend_totalfrom suggestion list or you can type it in expresion input then pressEnteron keyboard.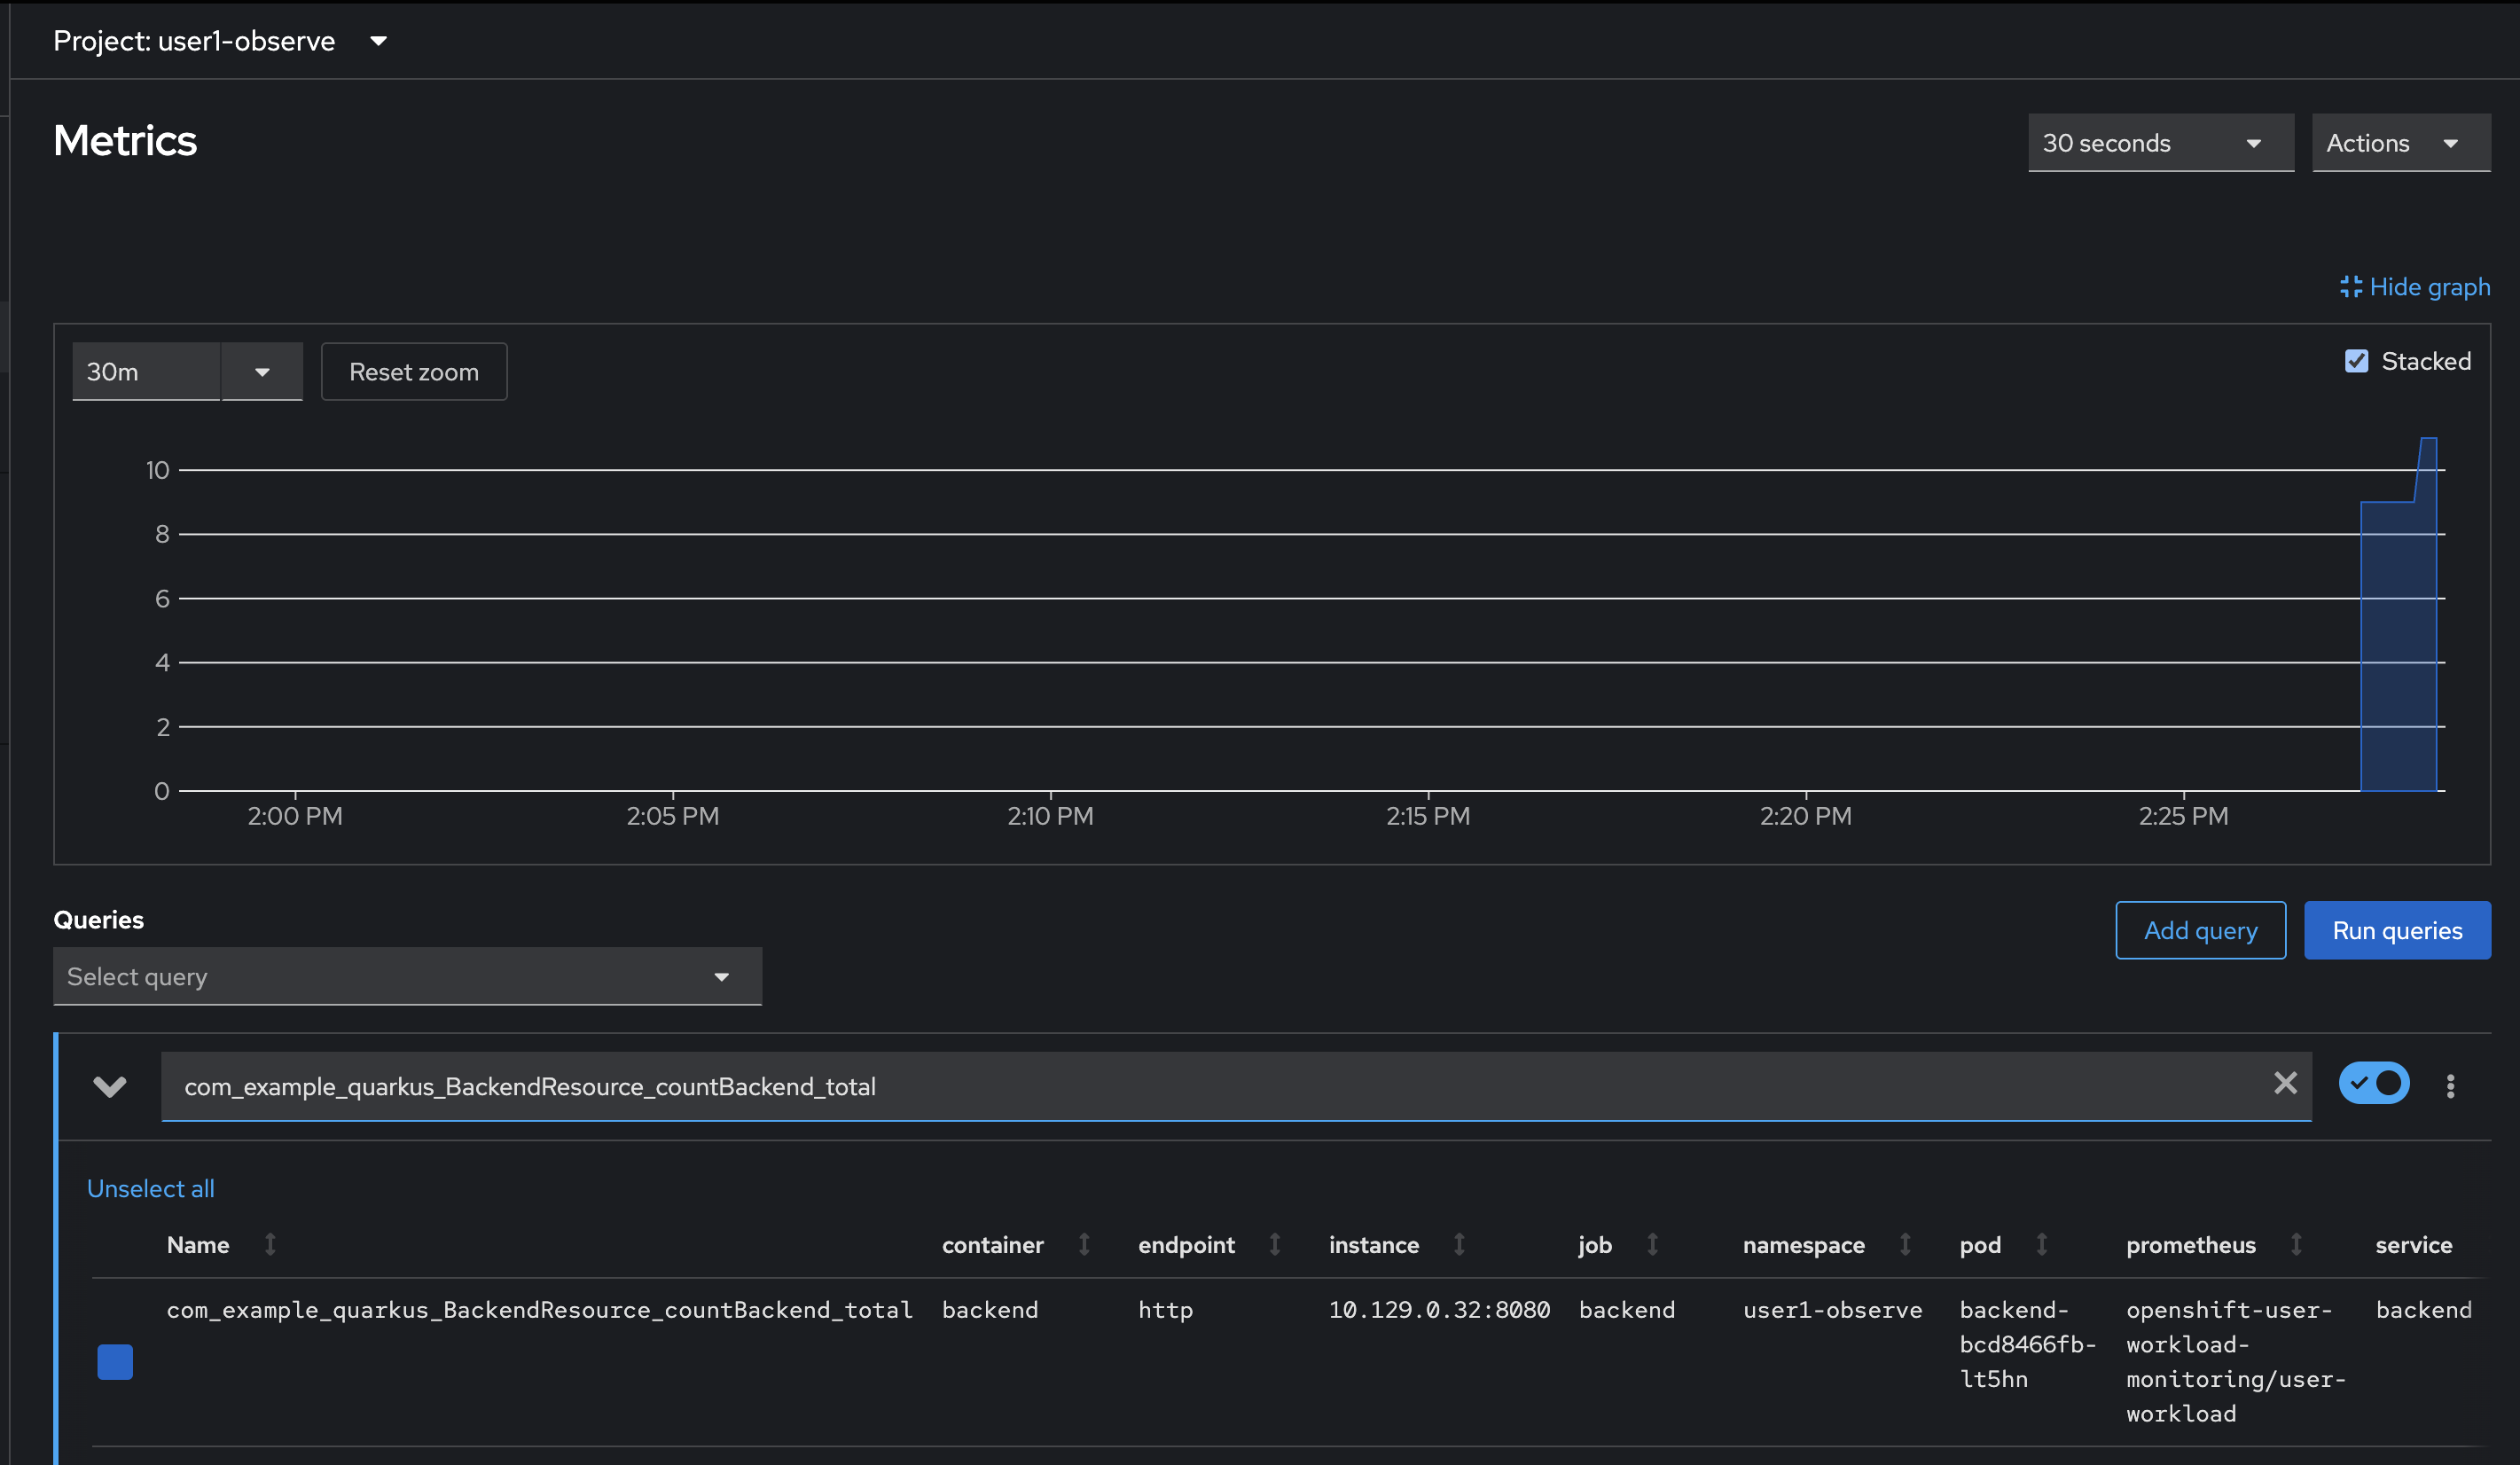
-
Now, try to query the metric with
ratefunction using PromQL to calcualte per-second average rate of API calls in 1 minute. Copy this query and paste in the expression input then pressEnter.rate(com_example_quarkus_BackendResource_countBackend_total[1m])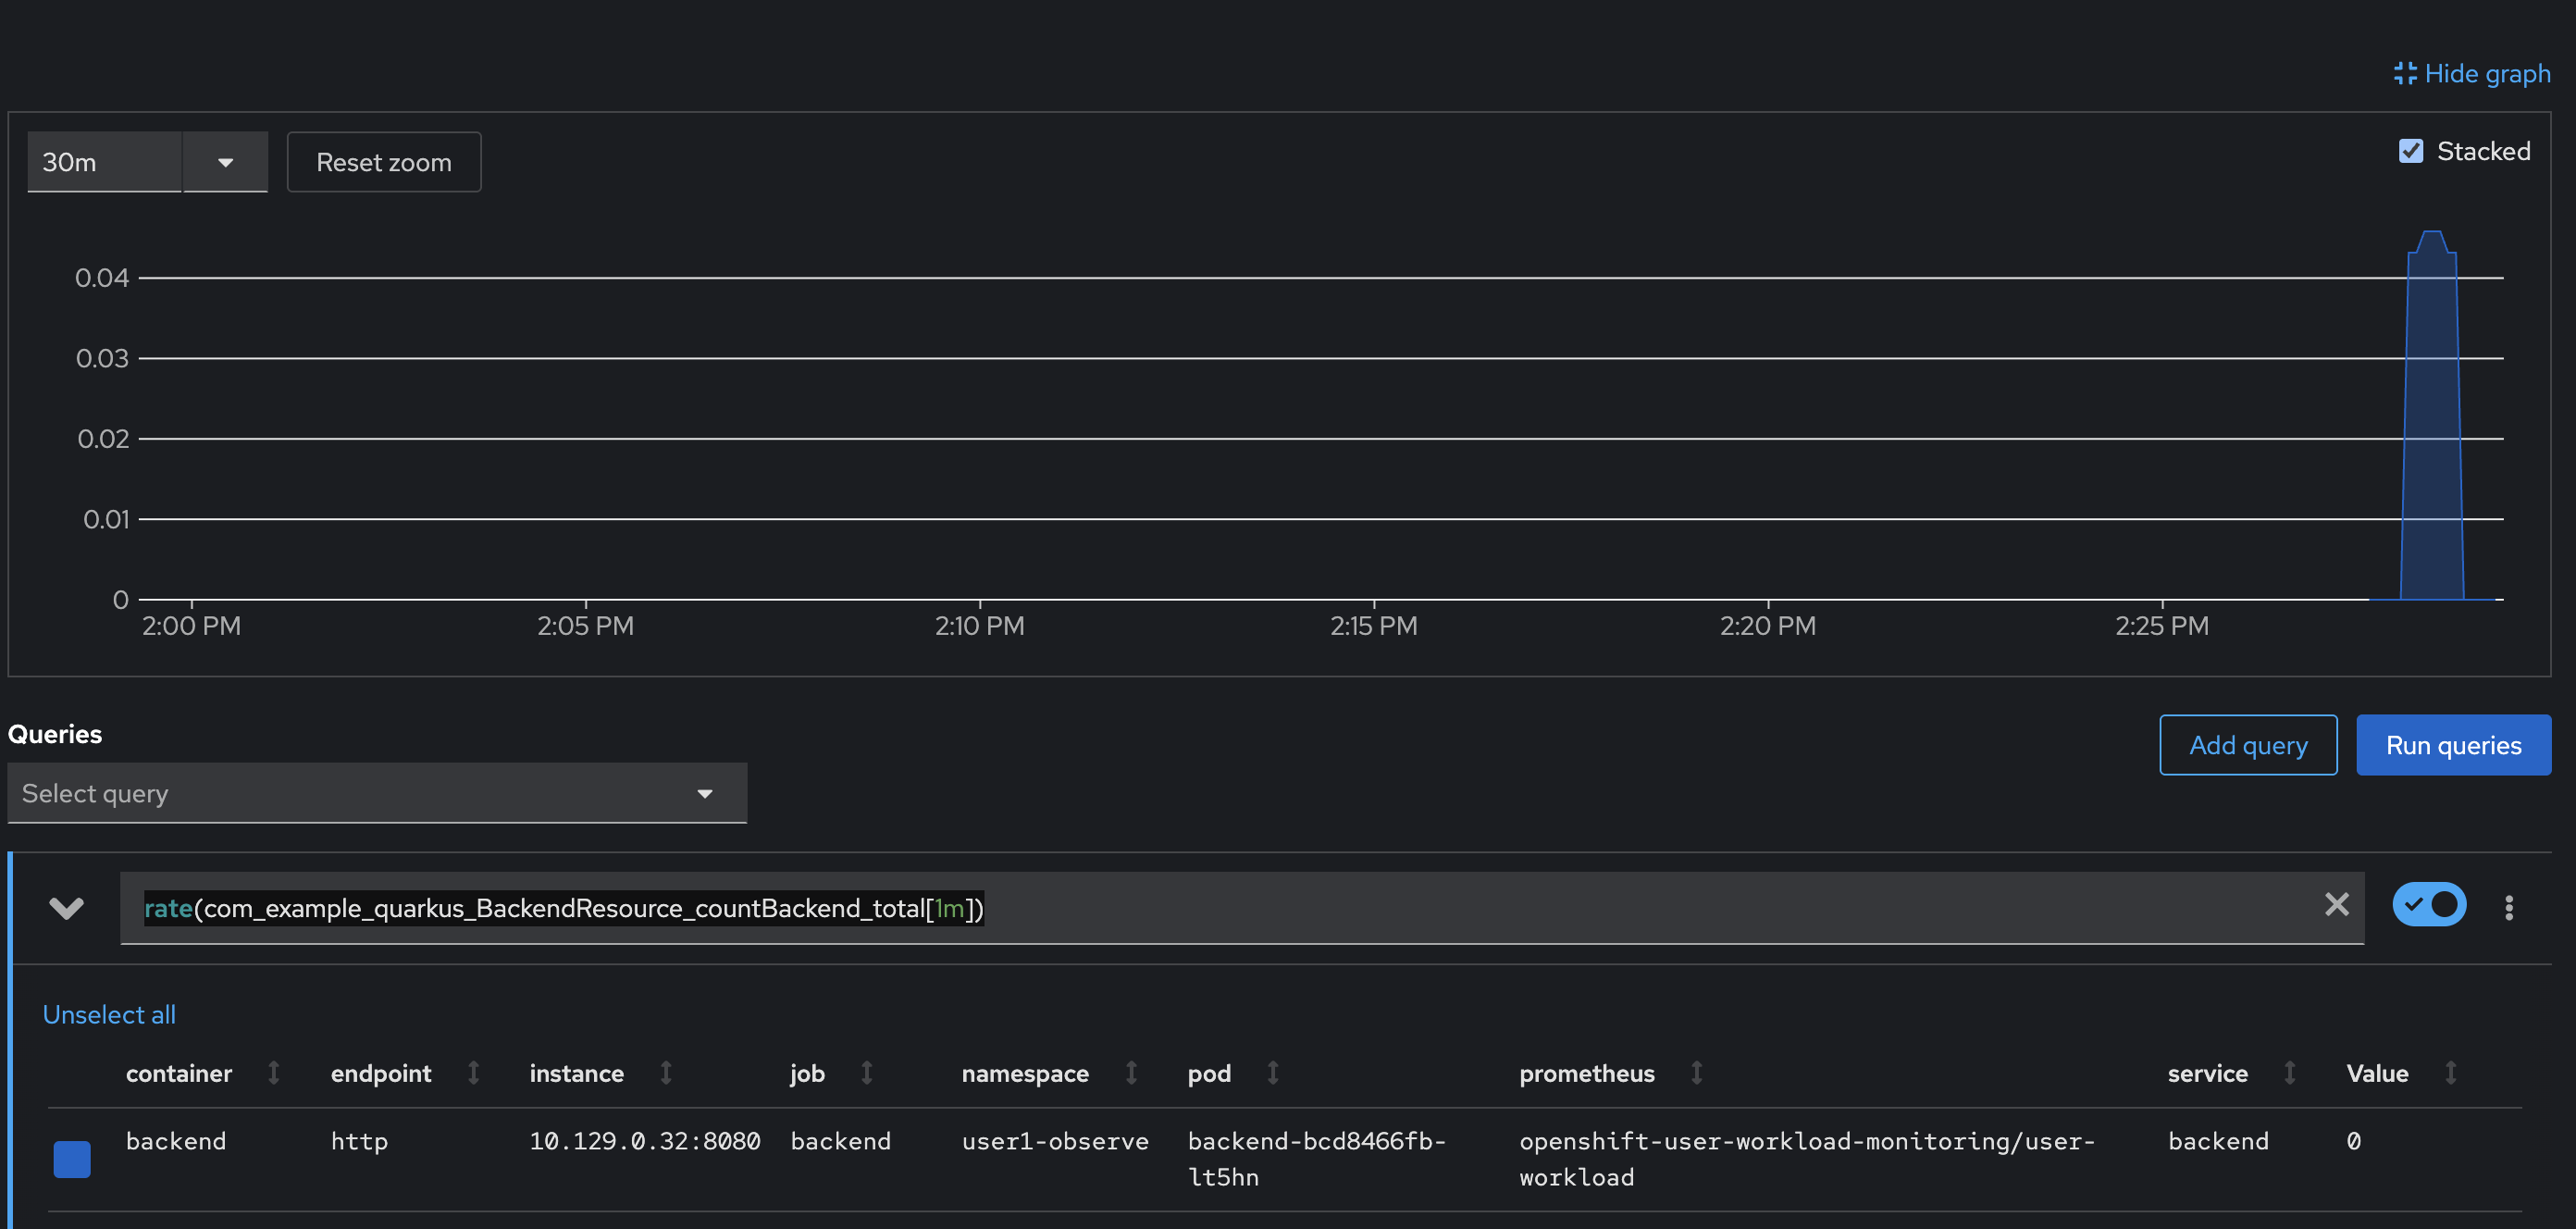
-
Run more
curlcommand in the web terminal and run the metric query again to see the result changes.Don’t forget to change userXin the command to match to your username.curl http://backend.userX-observe.svc.cluster.local:8080
Create Alert for Metrics
Keep looking at the metric values by running the PromQL is one of monitoring methods. But who will do that?
In real world, you won’t have time to keep your eyes on the OpenShift console and run the PromQL for every 5 seconds to see whether the metric value used to determine API call latency hits threshold or not, so you can, for example, scale up your application to be able to serve more request and so the latency is reduced.
What you need is something that can keep tracking the metric value and let you know when the value has hit threshold. This is where the Alert comes in.
-
Review this
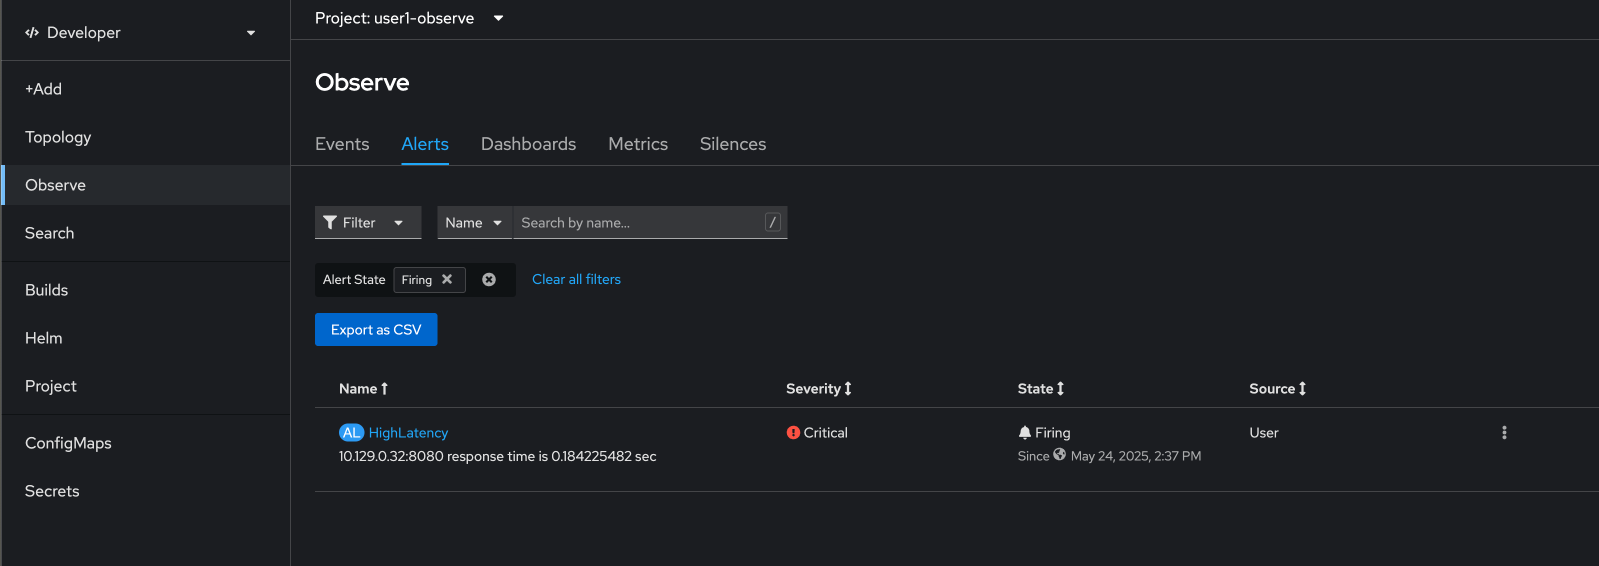
PrometheusRuleresource. This resource is used to configure an alert based on thecom_example_quarkus_BackendResource_timeBackend_seconds_maxmetric defined in theexpr(expression) field. The alert will be fired when the metric’s value is more than0.01(1 second).The com_example_quarkus_BackendResource_timeBackend_seconds_maxmetric is our custom metric in thebackendapplication used to measure processing time for an API. If the value of this metric is high, it means the API response time will be high as well so resulting high latency.apiVersion: monitoring.coreos.com/v1 kind: PrometheusRule metadata: name: backend-app-alert namespace: userX-observe labels: openshift.io/prometheus-rule-evaluation-scope: leaf-prometheus spec: groups: - name: backend rules: - alert: HighLatency expr: com_example_quarkus_BackendResource_timeBackend_seconds_max>0.01 labels: severity: 'critical' annotations: message: '{{ $labels.instance }} response time is {{ $value }} sec' -
Create the
PrometheusRuleresource above by click on the + button at the top right corner of OpenShift console then select Import YAML.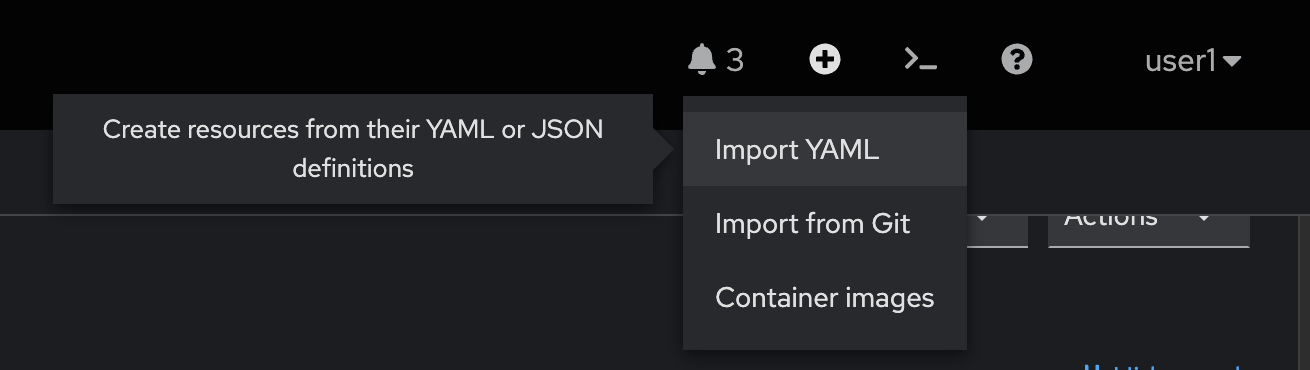
-
Copy the YAML from code snippet above and paste to YAML editor in OpenShift console. Update the
userX-observein thenamespacefield to matches to your username. Then click Create button.Don’t forget to update the userX-observein thenamespacefield to matches to your username. -
Run more
curlcommand in the web terminal to trigger API calls.Don’t forget to change userXin the command to match to your username.curl http://backend.userX-observe.svc.cluster.local:8080 -
Select Observe menu on the left, go to Alerts tab, and wait until the alert shows up. (Refresh web browser if you’ve waited more than 1-2 minutes and don’t see the alert.)
-
Go to the Topology menu, you should see the alert icon on
backendapplication.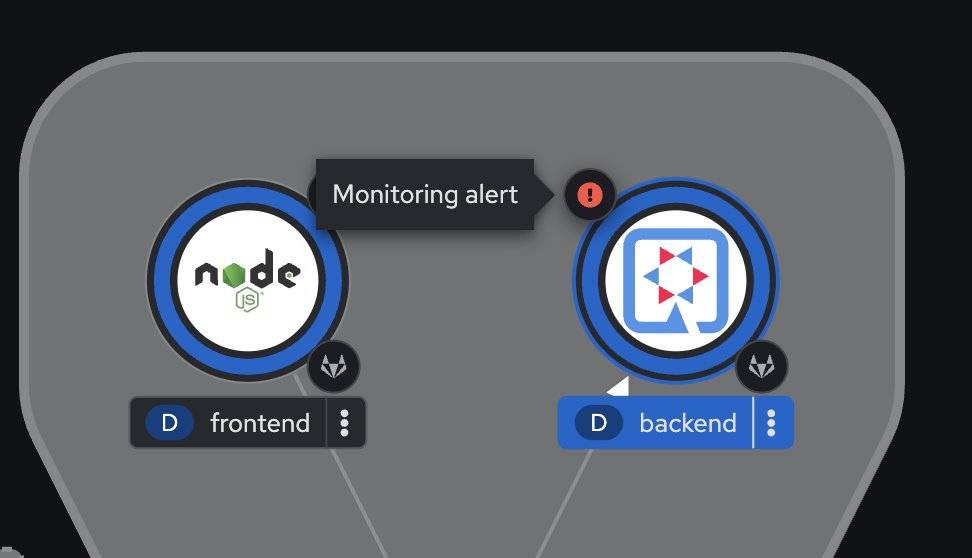
-
Delete the
PrometheusRuleresource we’ve created by click on Search menu on the left. Then filter forPrometheusRuleresource. Delete thebackend-app-alertresource by click on action menu then select Delete PrometheusRule.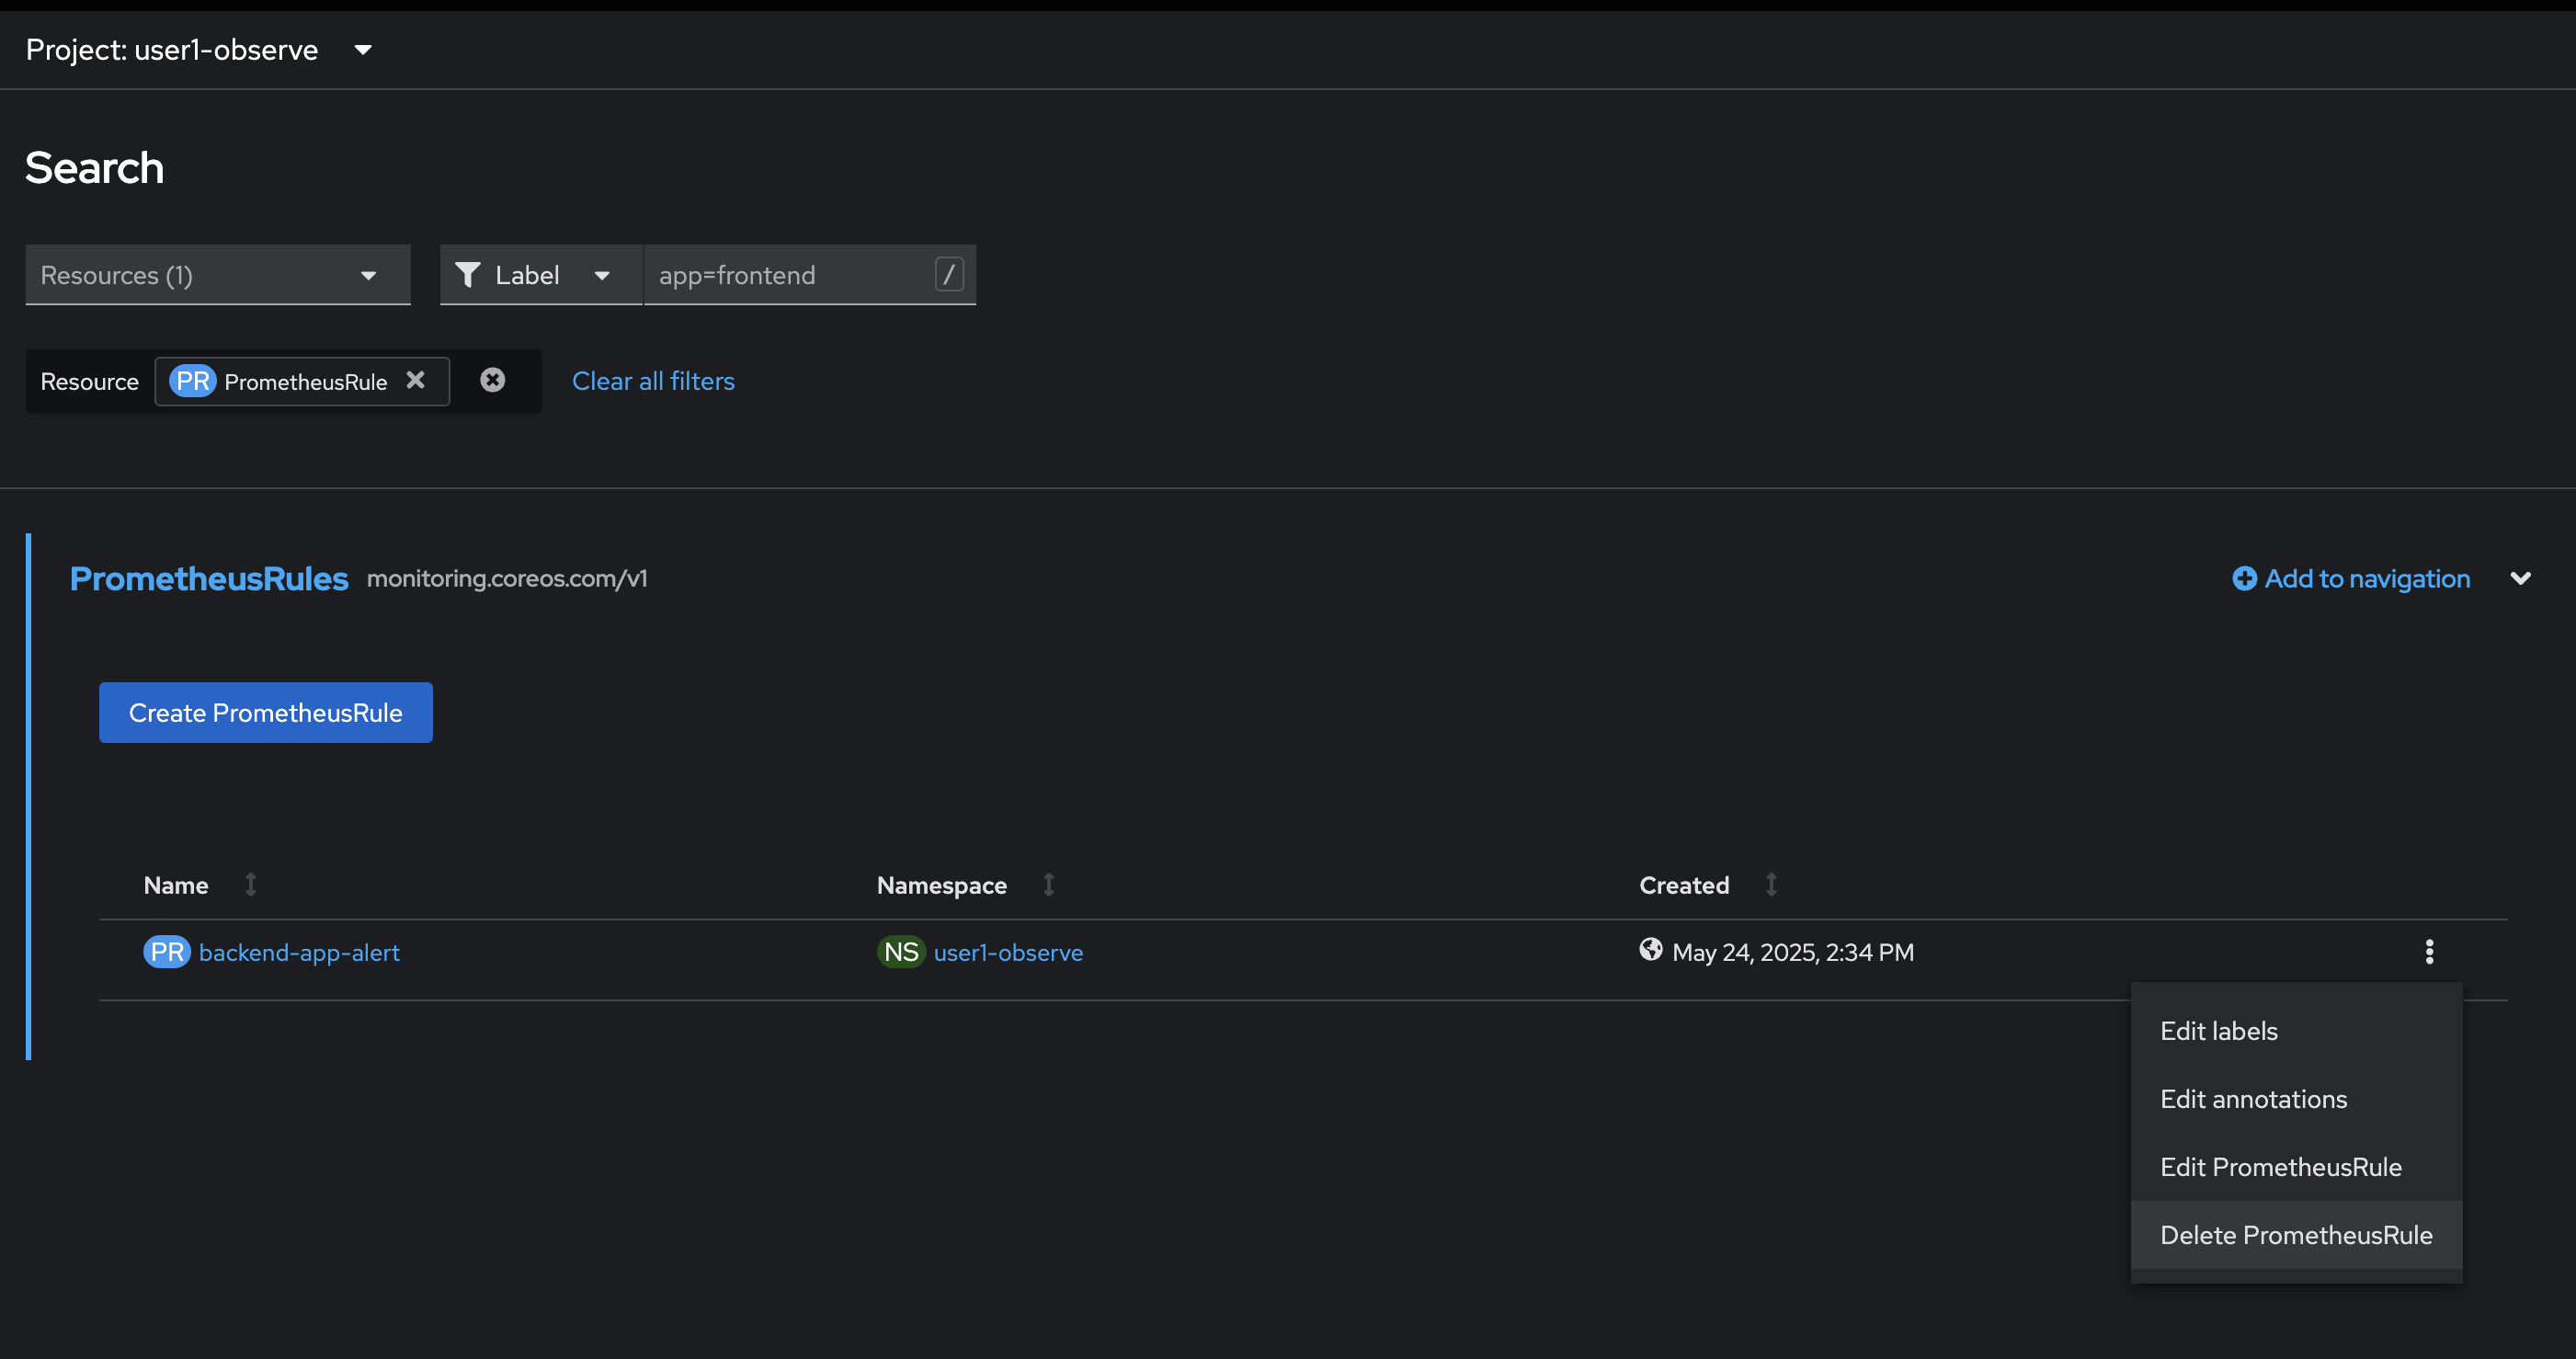
Summary
OpenShift Monitoring provides real-time visibility into cluster health and performance using integrated tools like Prometheus, AlertManager, etc. It helps detect issues early, ensuring high availability and reliability of applications. The built-in alerting system enables proactive response and efficient resource management.