Observability through logs: Centralized logging with Loki & querying via LogQL
OpenShift Observability
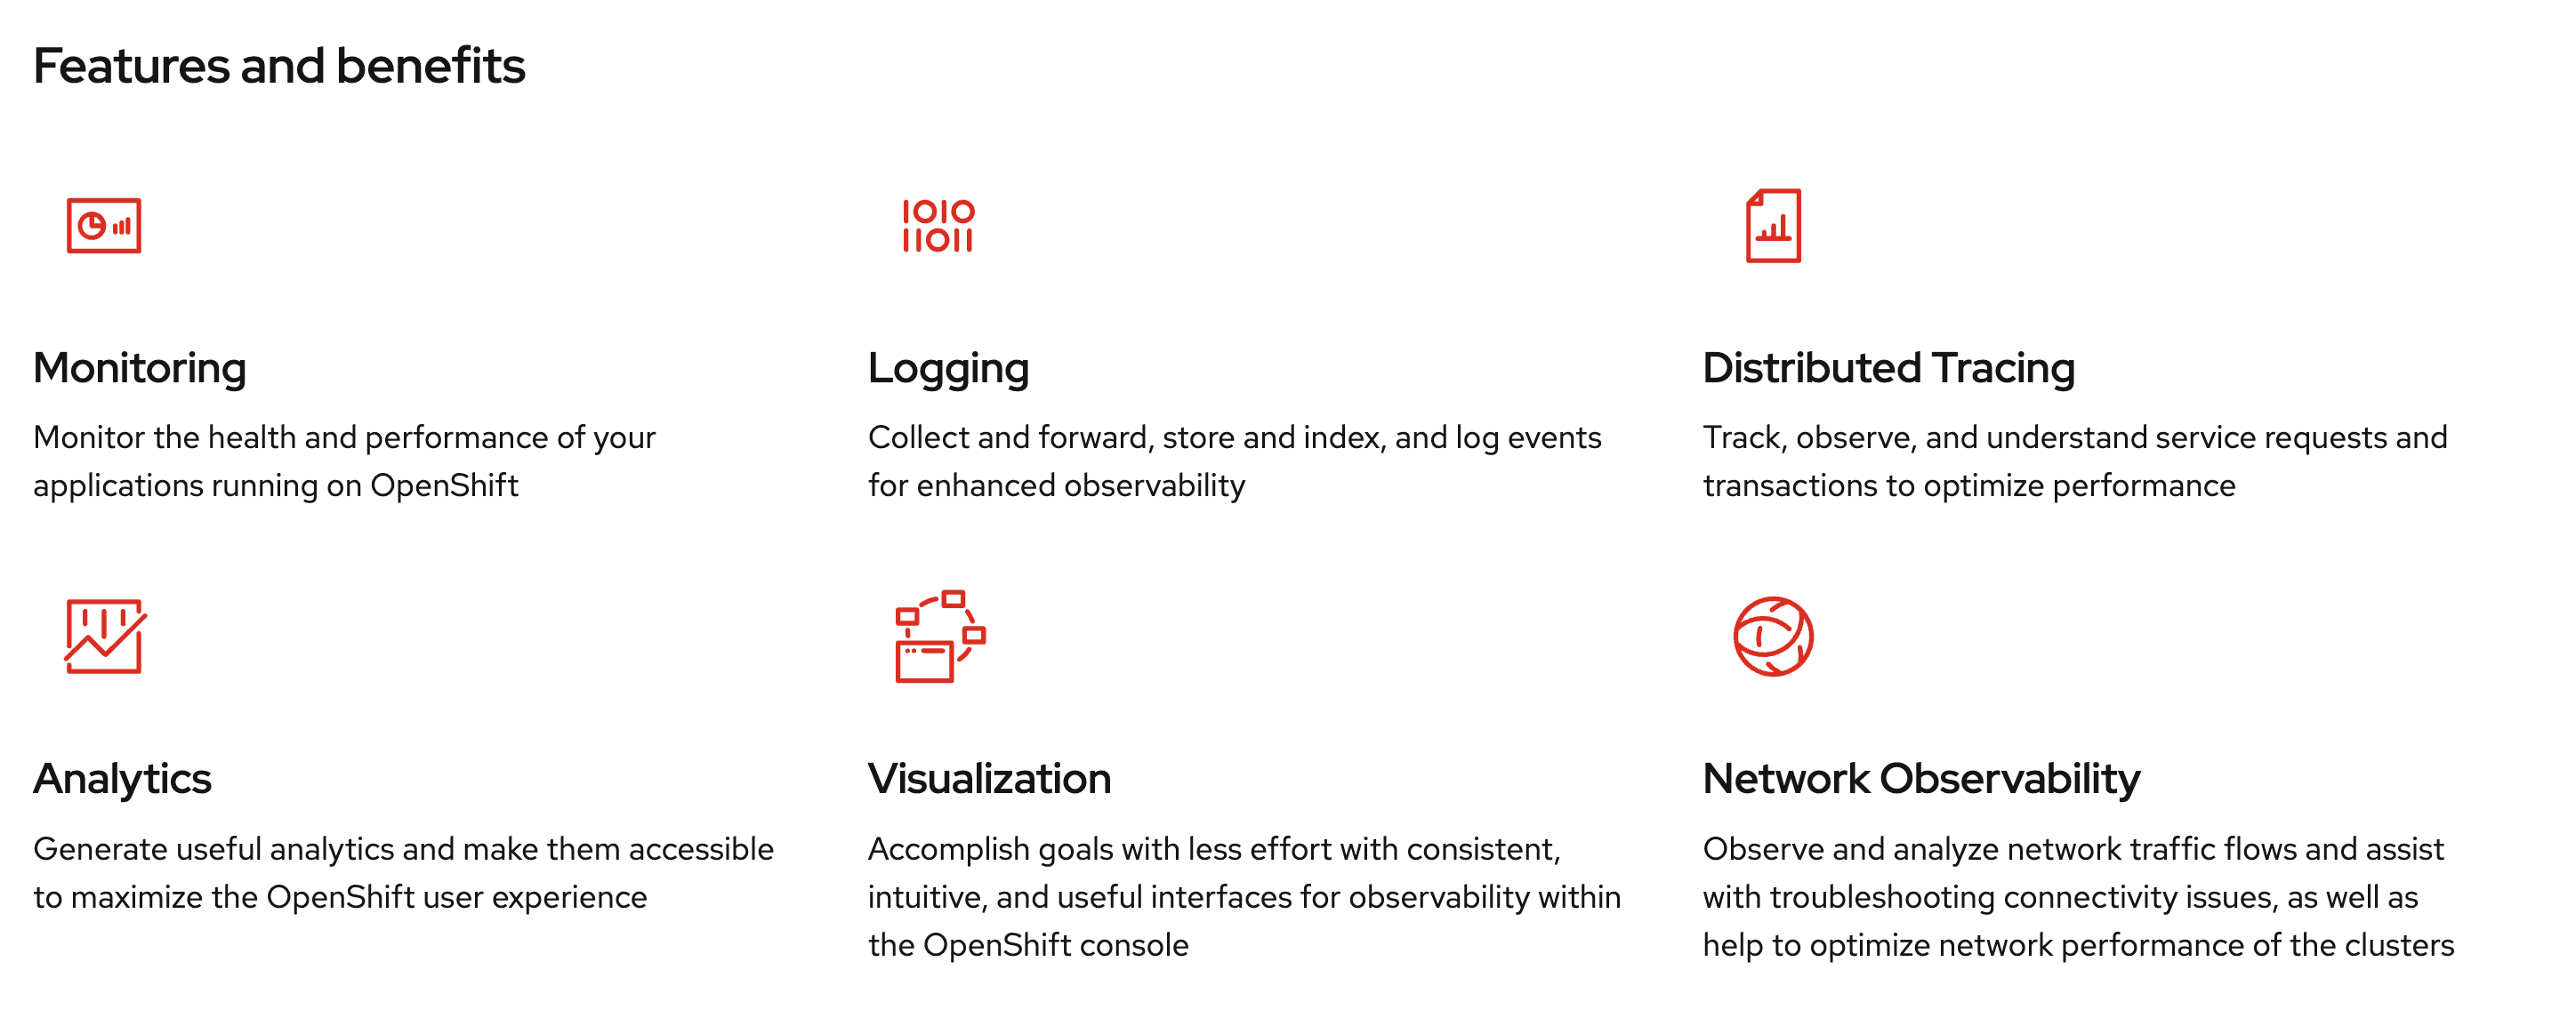
Red Hat® OpenShift® Observability is a comprehensive set of observability capabilities that provides deep insights into the performance and health of OpenShift-based applications and infrastructure across any footprint: the public cloud, on-prem, and edge.
Red Hat OpenShift Observability provides real-time visibility, monitoring, and analysis of various system metrics, logs, traces, and events to help you quickly diagnose and troubleshoot issues before they impact your applications or end users.
It streamlines metrics, traces and logs, while aggregating and transporting your data. Red Hat OpenShift Observability allows you to gain visibility into your clusters through efficient user interfaces and empowers your teams to make data-driven decisions.
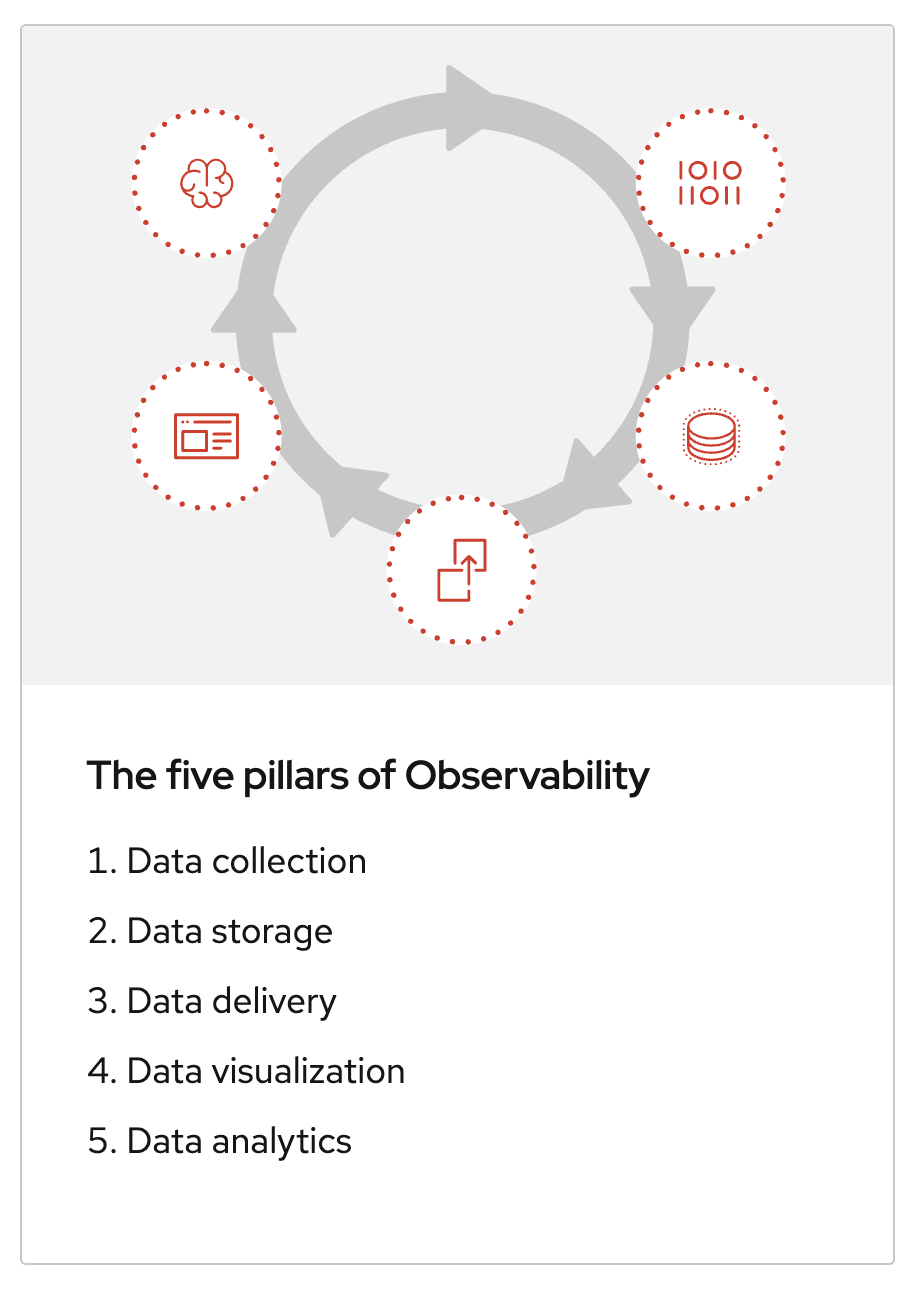
With our balanced approach and 5 pillars, you can monitor capabilities and optimize your infrastructure seamlessly.
OpenShift Logging
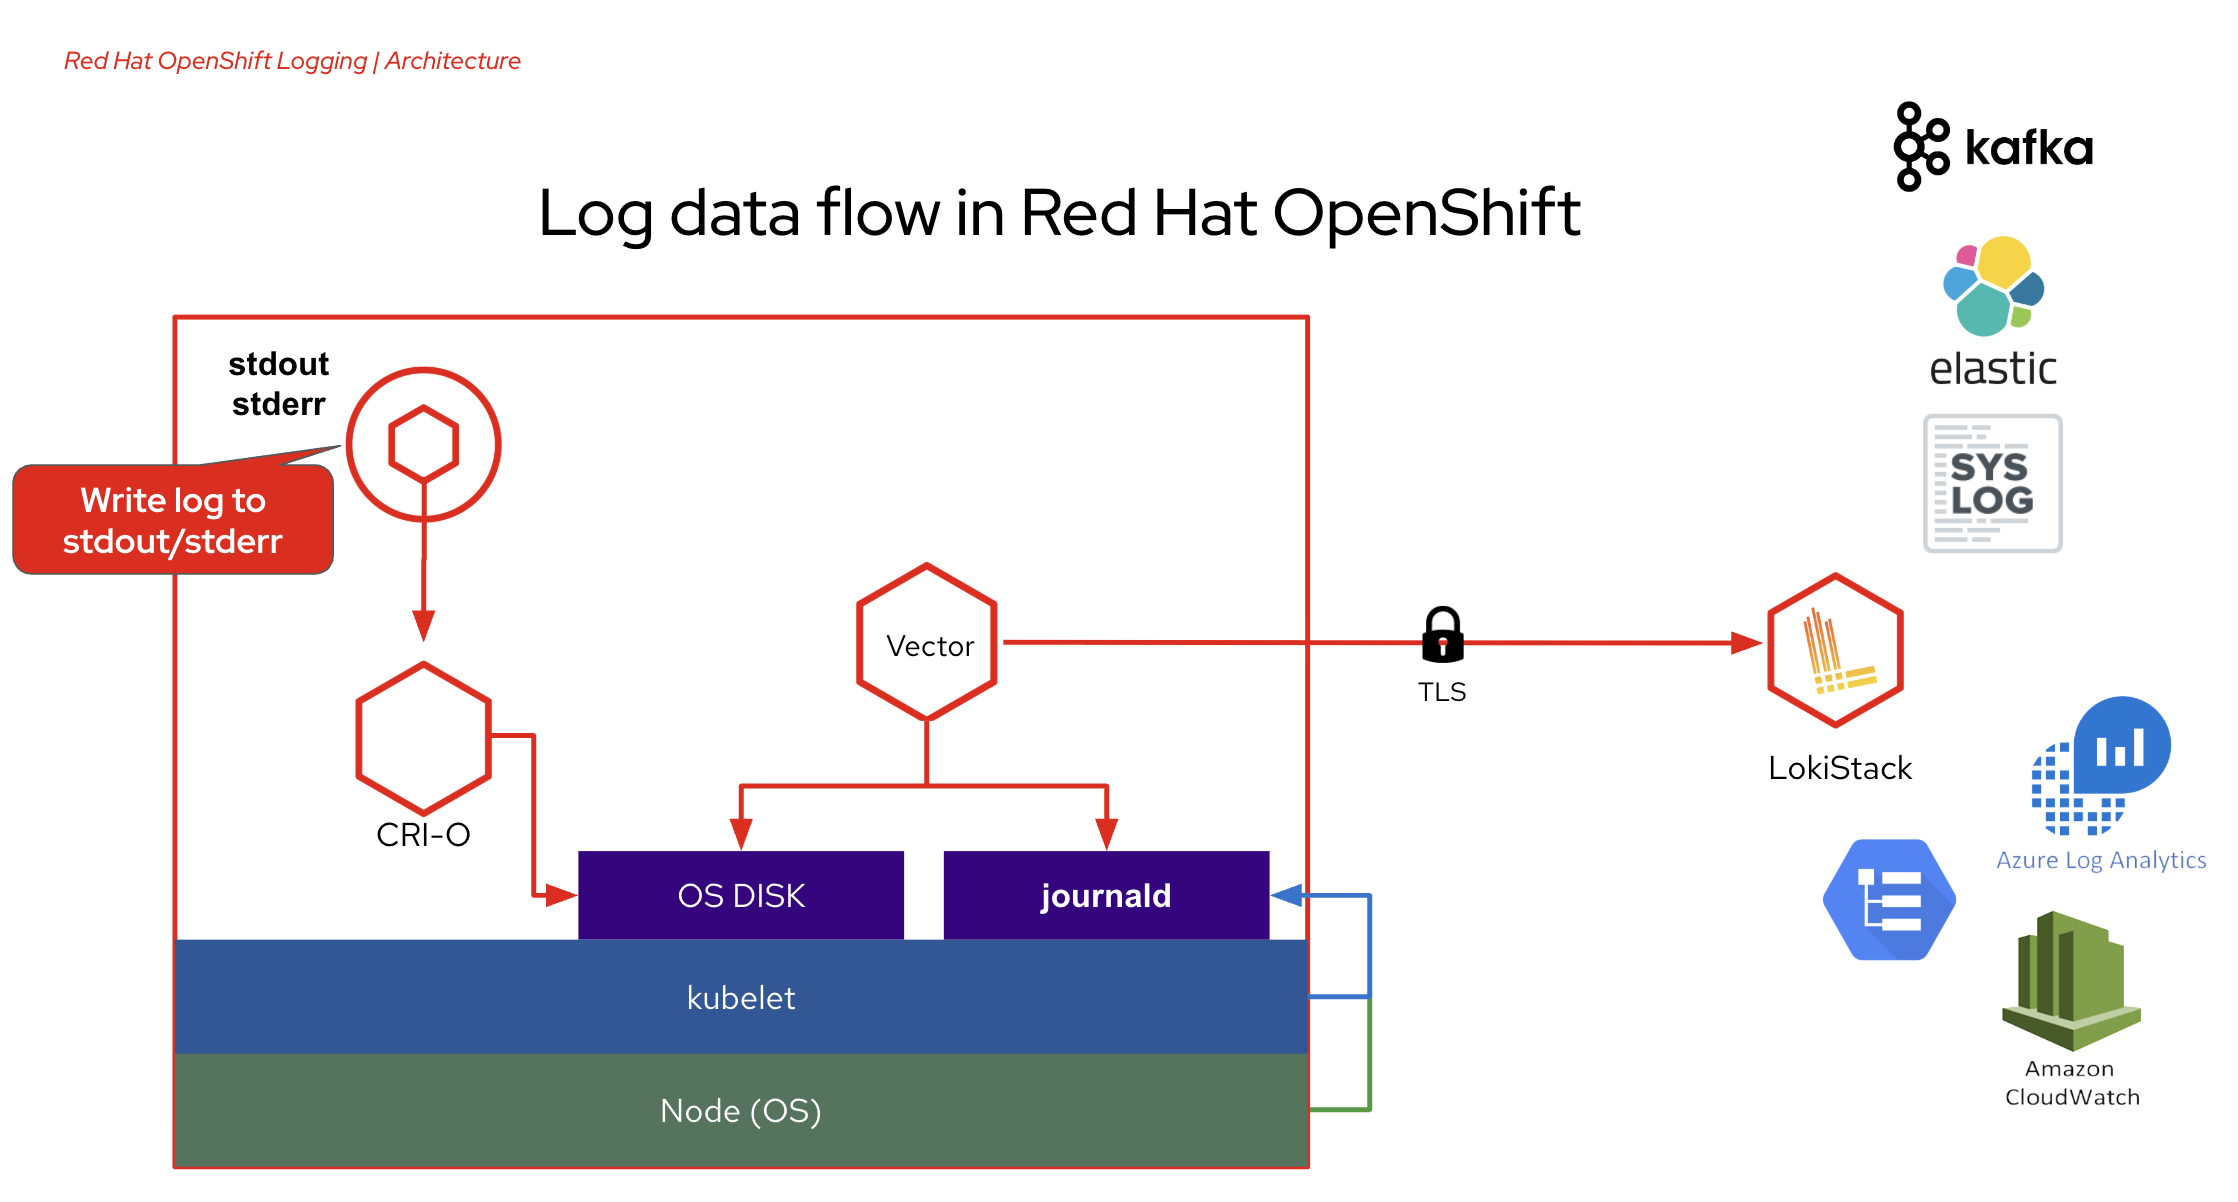
With OpenShift Container Platform, you can deploy OpenShift Logging to aggregate all the logs from your OpenShift Container Platform cluster, such as node system audit logs, application container logs, and infrastructure logs. OpenShift Logging aggregates these logs from throughout your cluster and stores them in a default log store.
OpenShift Logging aggregates the following types of logs:
-
application - Container logs generated by user applications running in the cluster, except infrastructure container applications.
-
infrastructure - Logs generated by infrastructure components running in the cluster and OpenShift Container Platform nodes, such as journal logs. Infrastructure components are pods that run in the
openshift-*,kube-*, ordefaultprojects. -
audit - Logs generated by auditd, the node audit system, which are stored in the
/var/log/audit/audit.logfile, and the audit logs from the Kubernetes apiserver and the OpenShift apiserver.
Logging resources
-
ClusterLogging (CL) , After the Operators are installed, you create a
ClusterLoggingcustom resource (CR) to schedule logging pods and other resources necessary to support the logging. TheClusterLoggingCR deploys the collector and forwarder, which currently are both implemented by a daemonset running on each node. The Red Hat OpenShift Logging Operator watches theClusterLoggingCR and adjusts the logging deployment accordingly. -
ClusterLogForwarder (CLF) - Generates collector configuration to forward logs per user configuration. The collector is based on Vector.
-
LokiStack - Controls the Loki cluster as log store and the web proxy with OpenShift Container Platform authentication integration to enforce multi-tenancy.
Loki is a horizontally scalable, highly available, multi-tenant log aggregation system offered as a GA log store for logging for Red Hat OpenShift that can be visualized with the OpenShift Observability UI.
The Loki configuration provided by OpenShift Logging is a short-term log store designed to enable users to perform fast troubleshooting with the collected logs. For that purpose, the logging for Red Hat OpenShift configuration of Loki has short-term storage, and is optimized for very recent queries. For long-term storage or queries over a long time period, users should look to log stores external to their cluster.
Logging for Red Hat OpenShift is an opinionated collector and normalizer of application, infrastructure, and audit logs. It is intended to be used for forwarding logs to various supported systems.
Need more details about OpenShift Logging? Visit this link.
Review Application Codes and Deployment Configuraitons
The sample applications used in this lab are consisted of 3 different applications:
-
frontend - A simple web application acts as a frontend application developed with Node.js.
-
simple-go - A Go application developed with Golang provides APIs for frontend application.
-
backend - A Java application developed with Quarkus Framework. acts as a backend application.
Review these application deployment configurations as well as the application codes to understand how logging works.
Applications Deployment Configurations
-
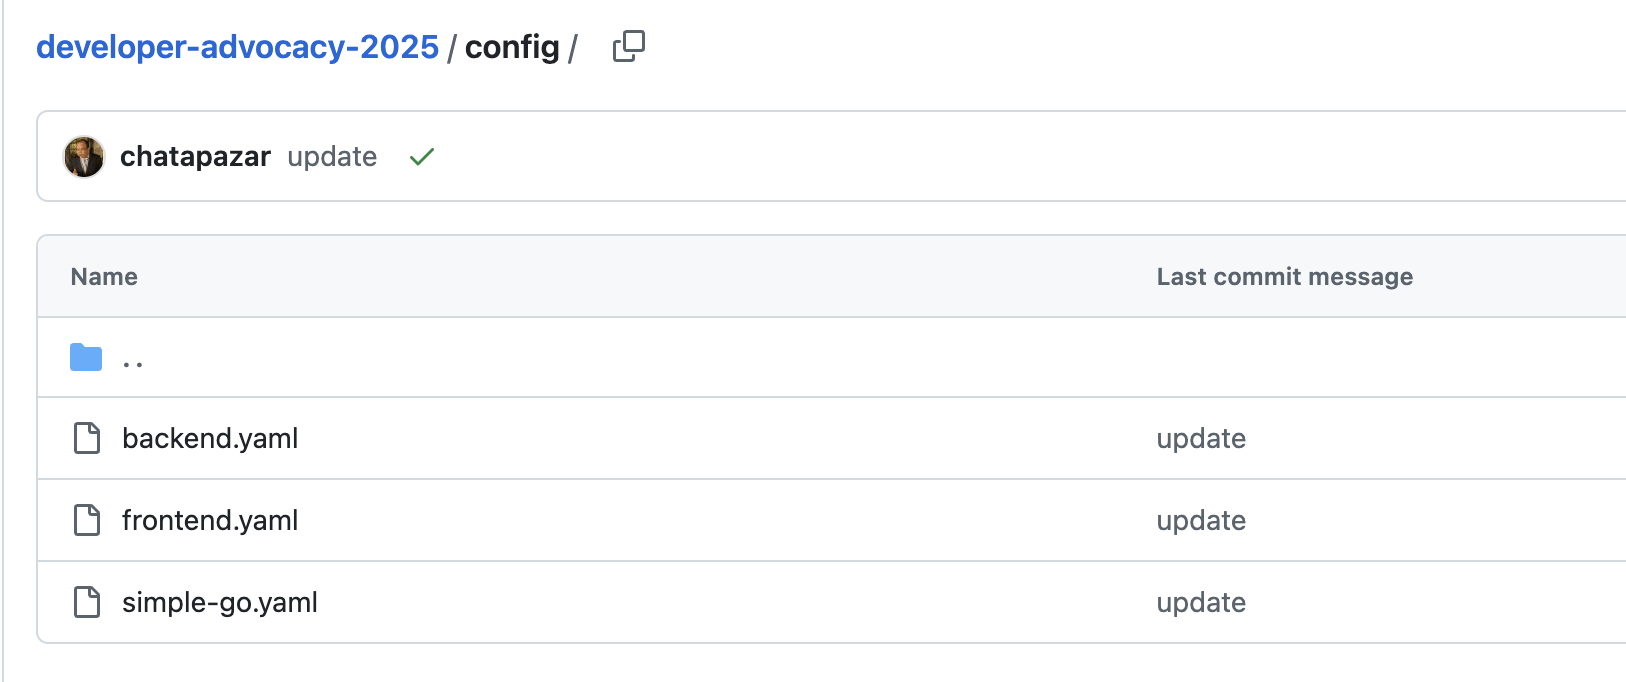
Go to https://github.com/rhthsa/developer-advocacy-2025/tree/main/config Git repository to see deployment configurations.
-
Review
DeploymentandServiceresoures of thebackendapplication inbackend.yamlfile.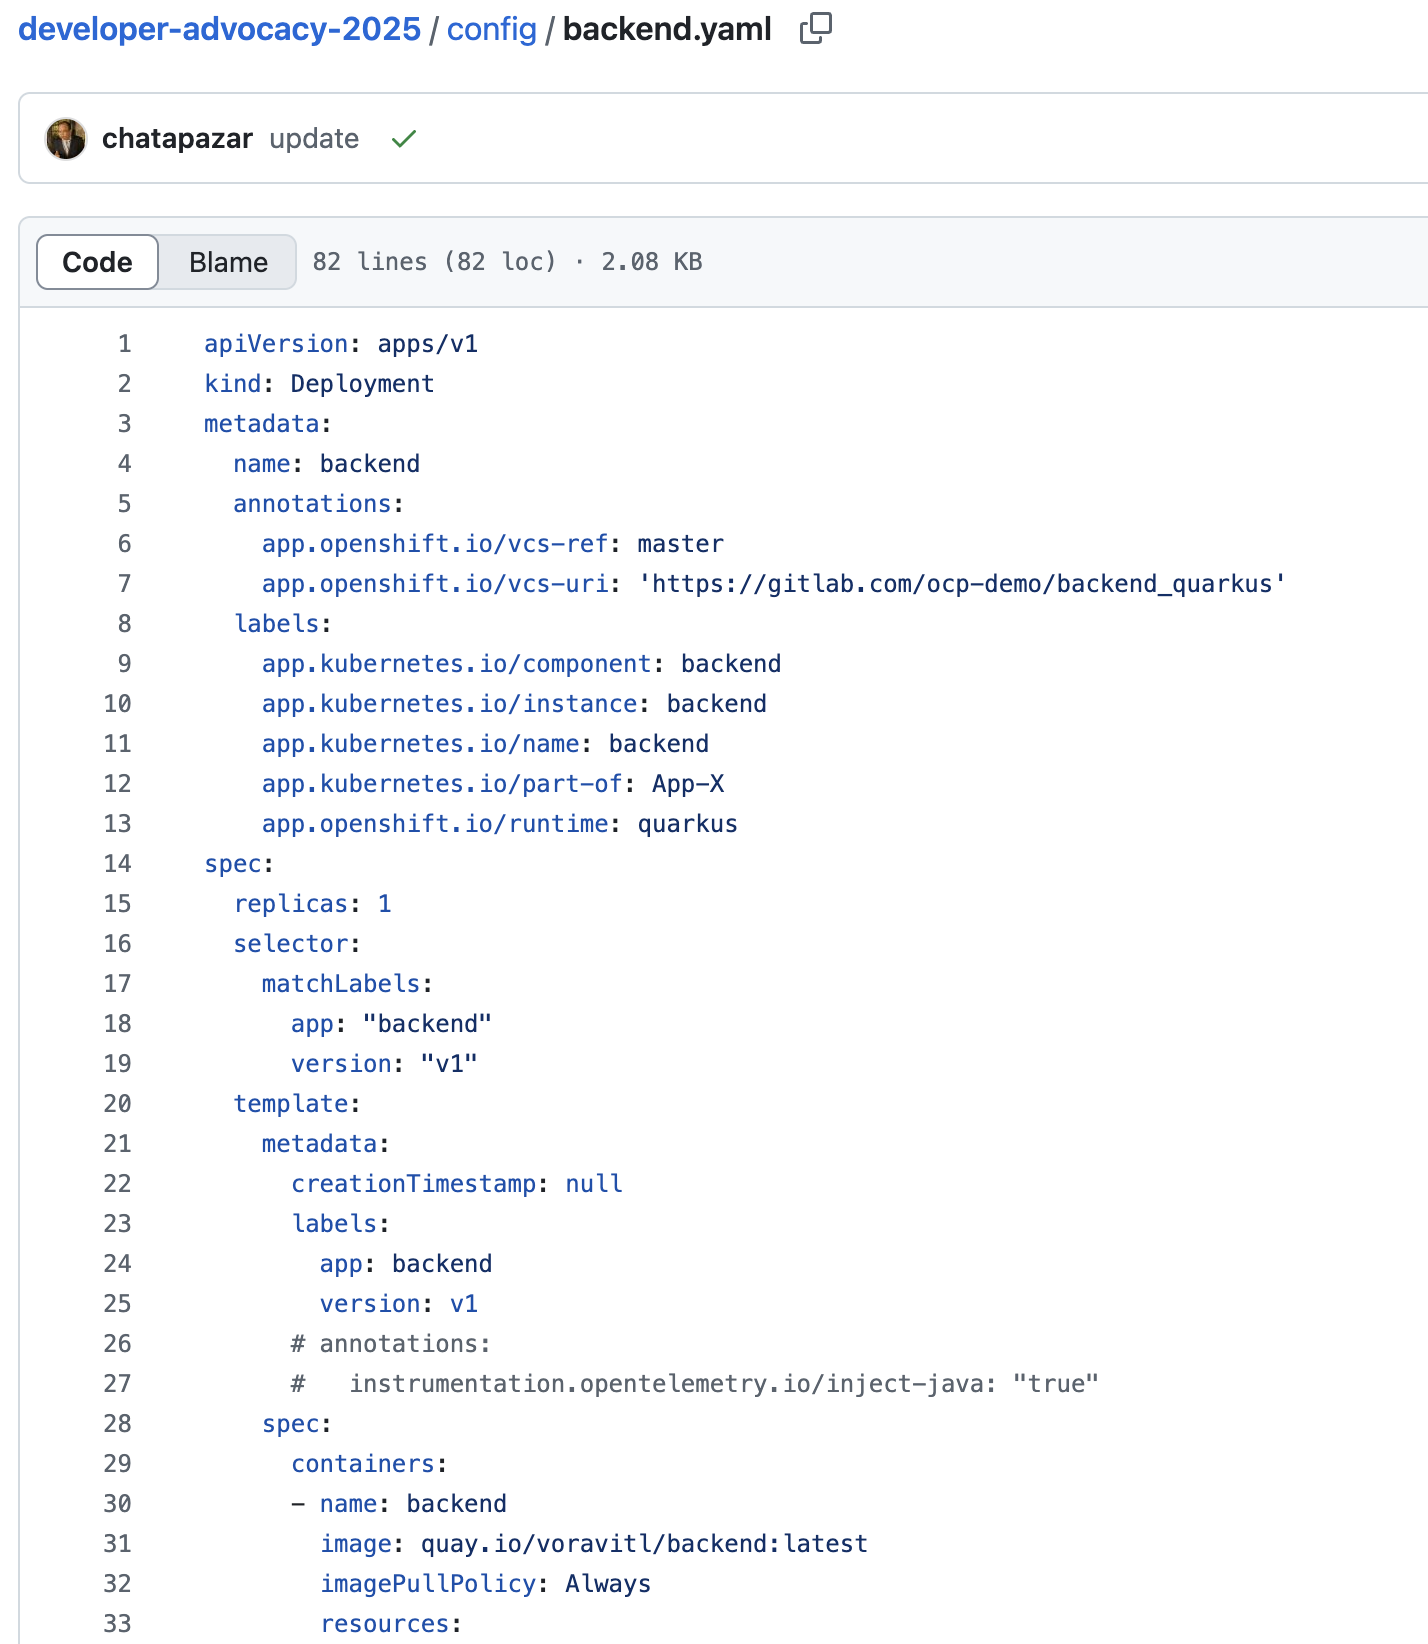
-
Review
DeploymentandServiceof thesimple-goapplication insimple-go.yamlfile.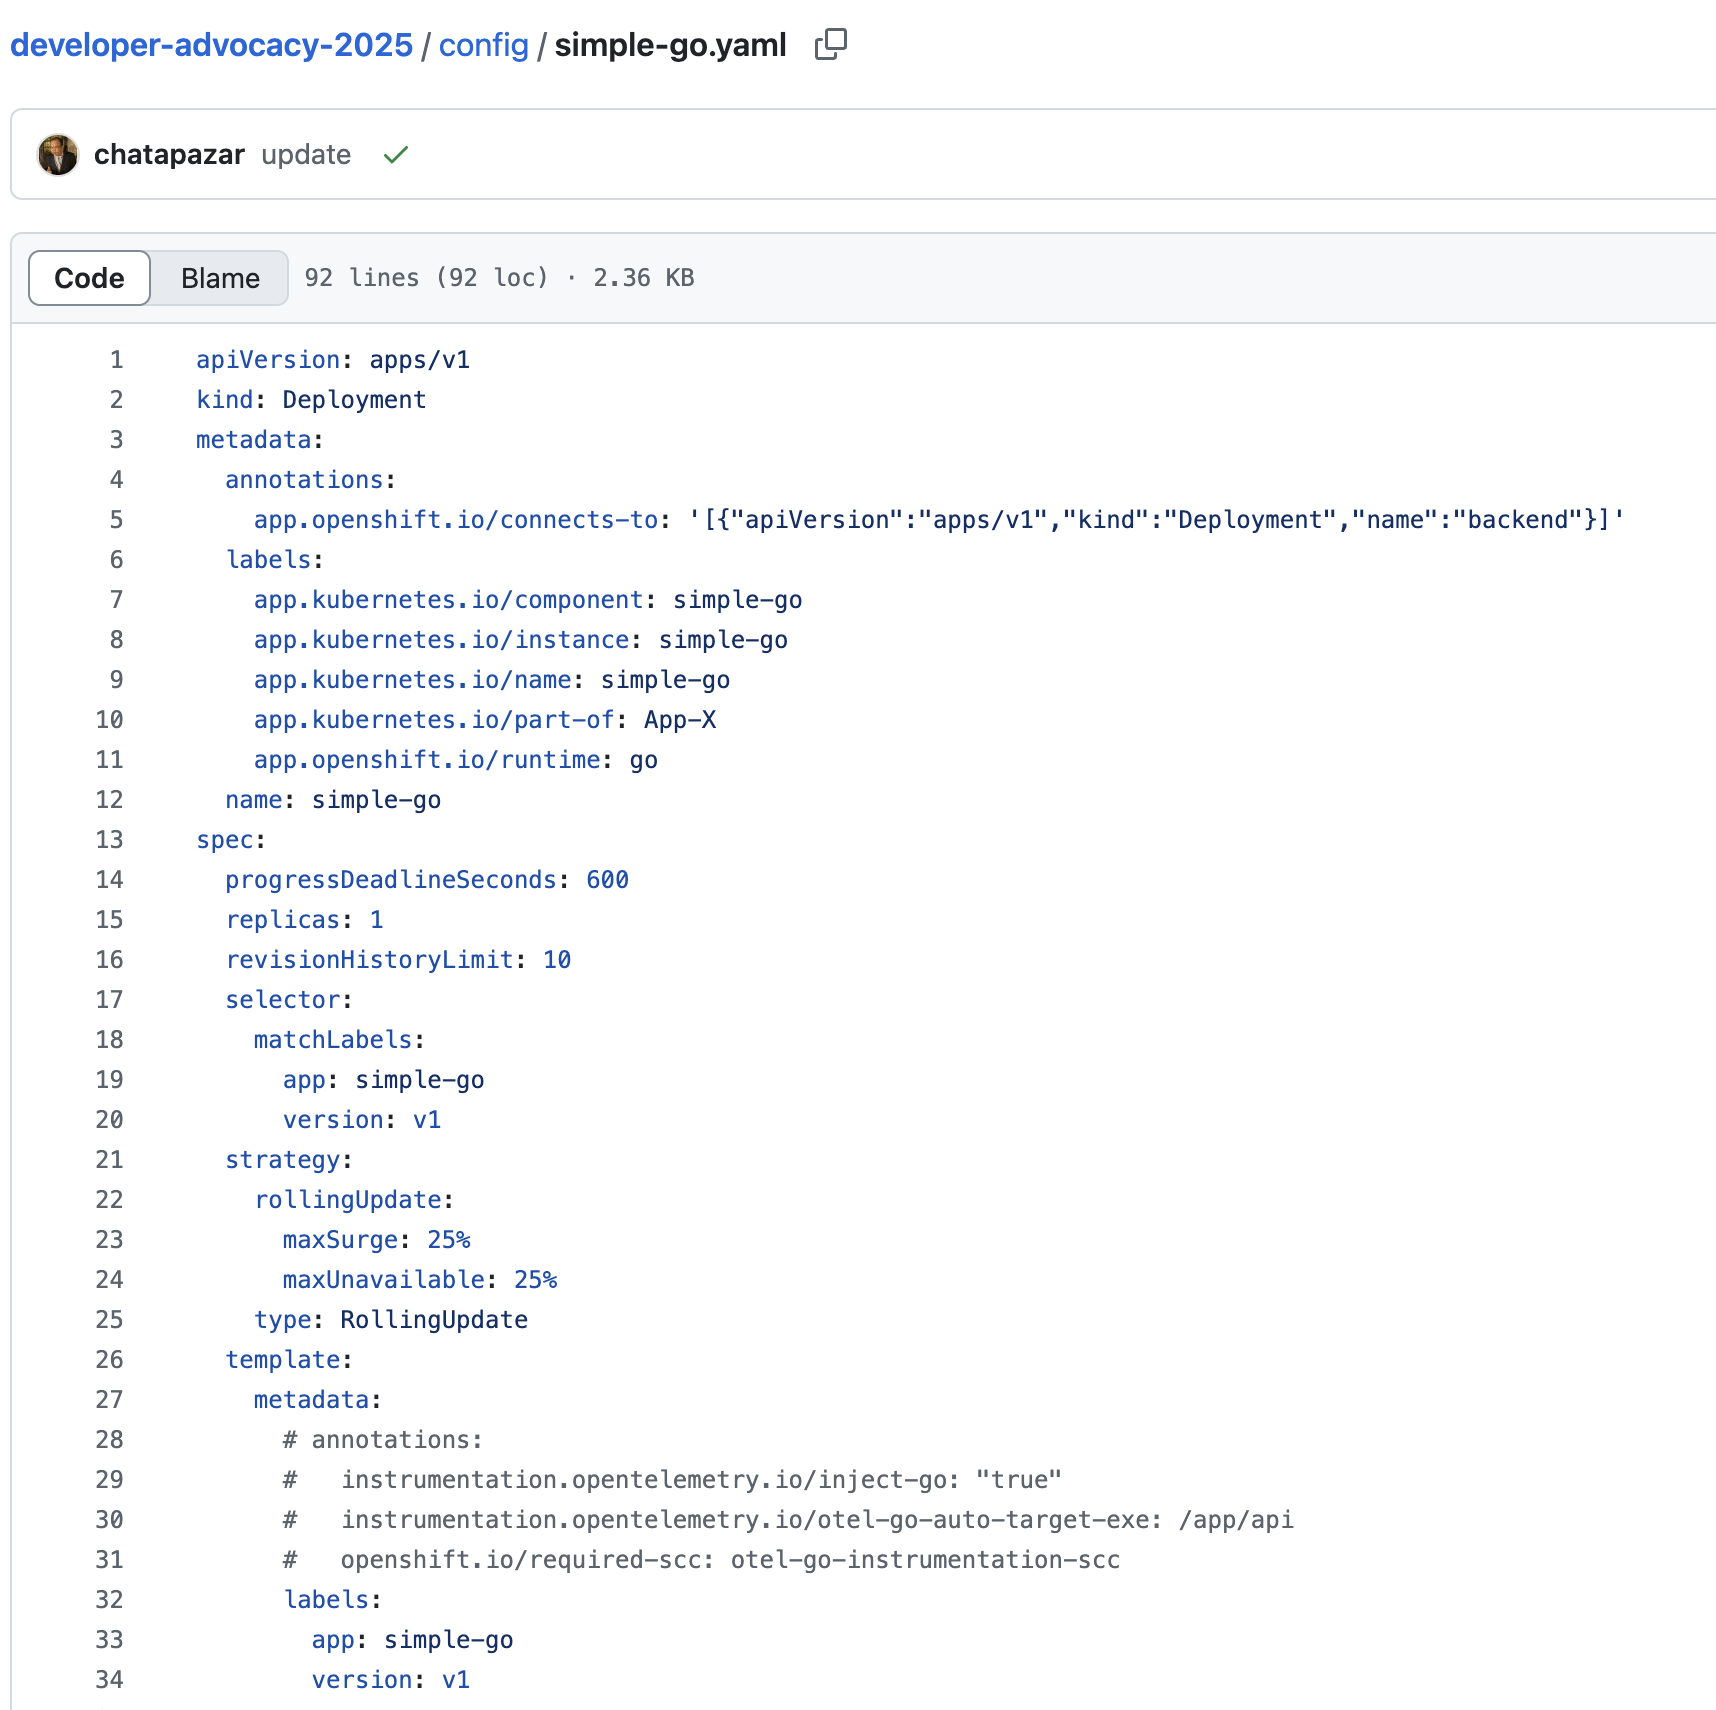
-
For
Deploymentresource insimple-go.yamlfile, you should see an environment variable namedBACKEND, the value is thebackendapplication endpoint that thesimple-goapplication will call to thebackendapplication via this URL.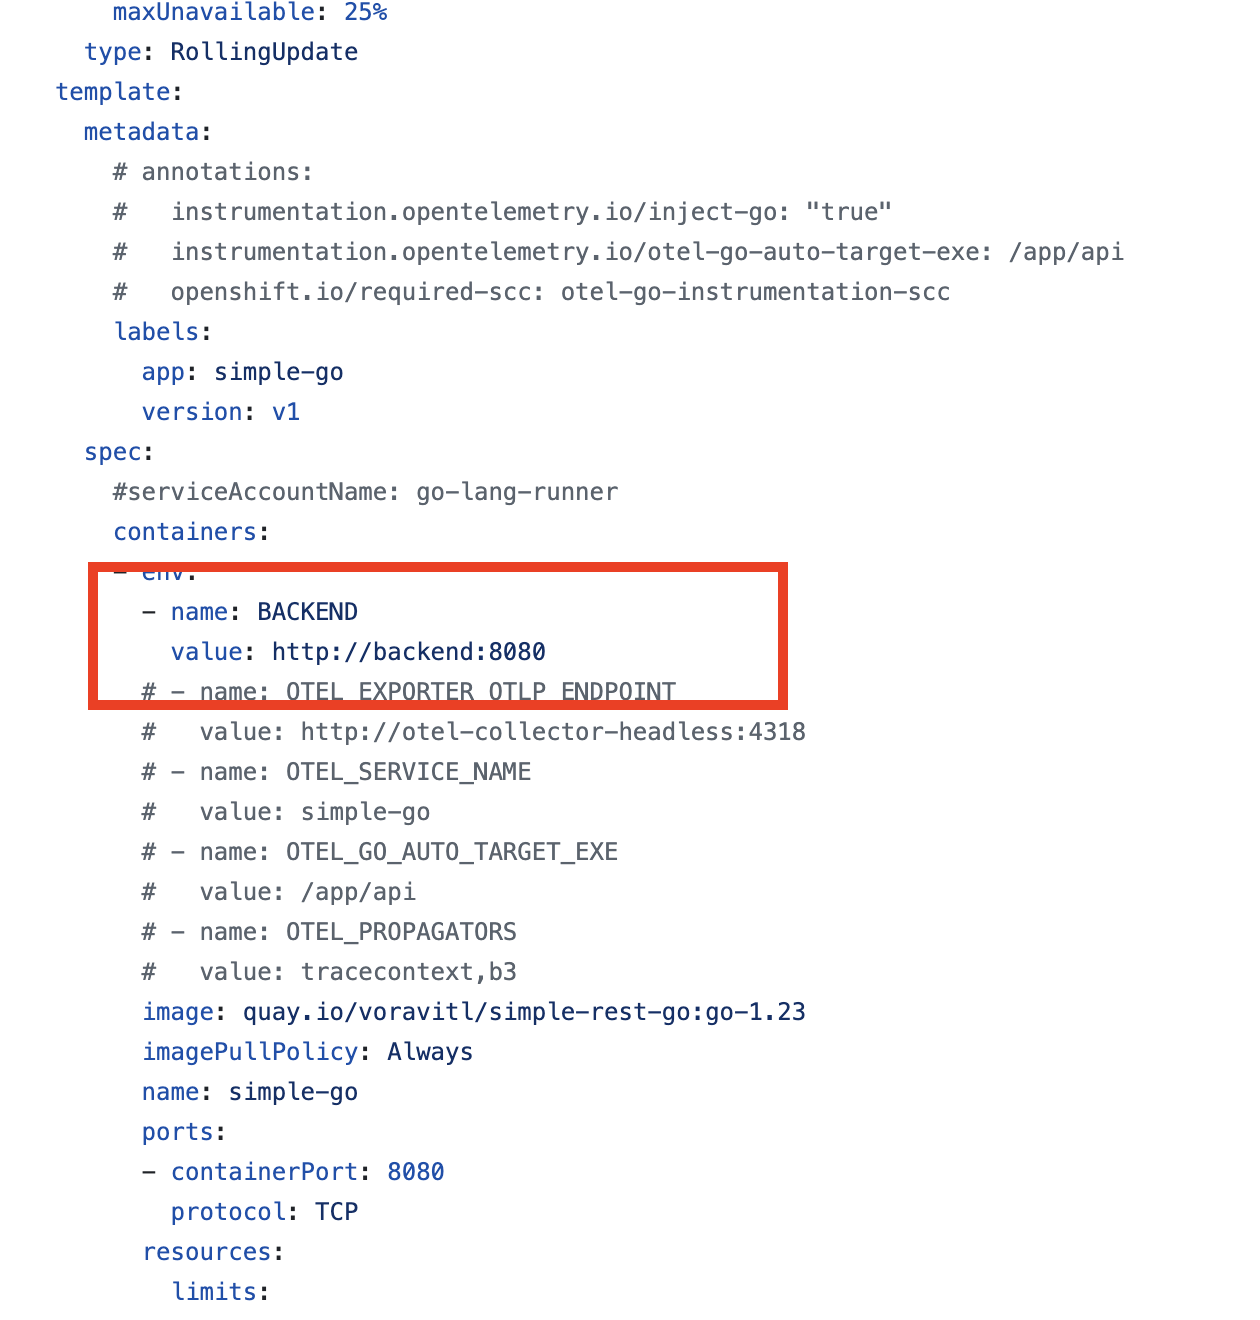
-
Review
Deployment,ServiceandRouteresources of thefrontendapplication infrontend.yamlfile.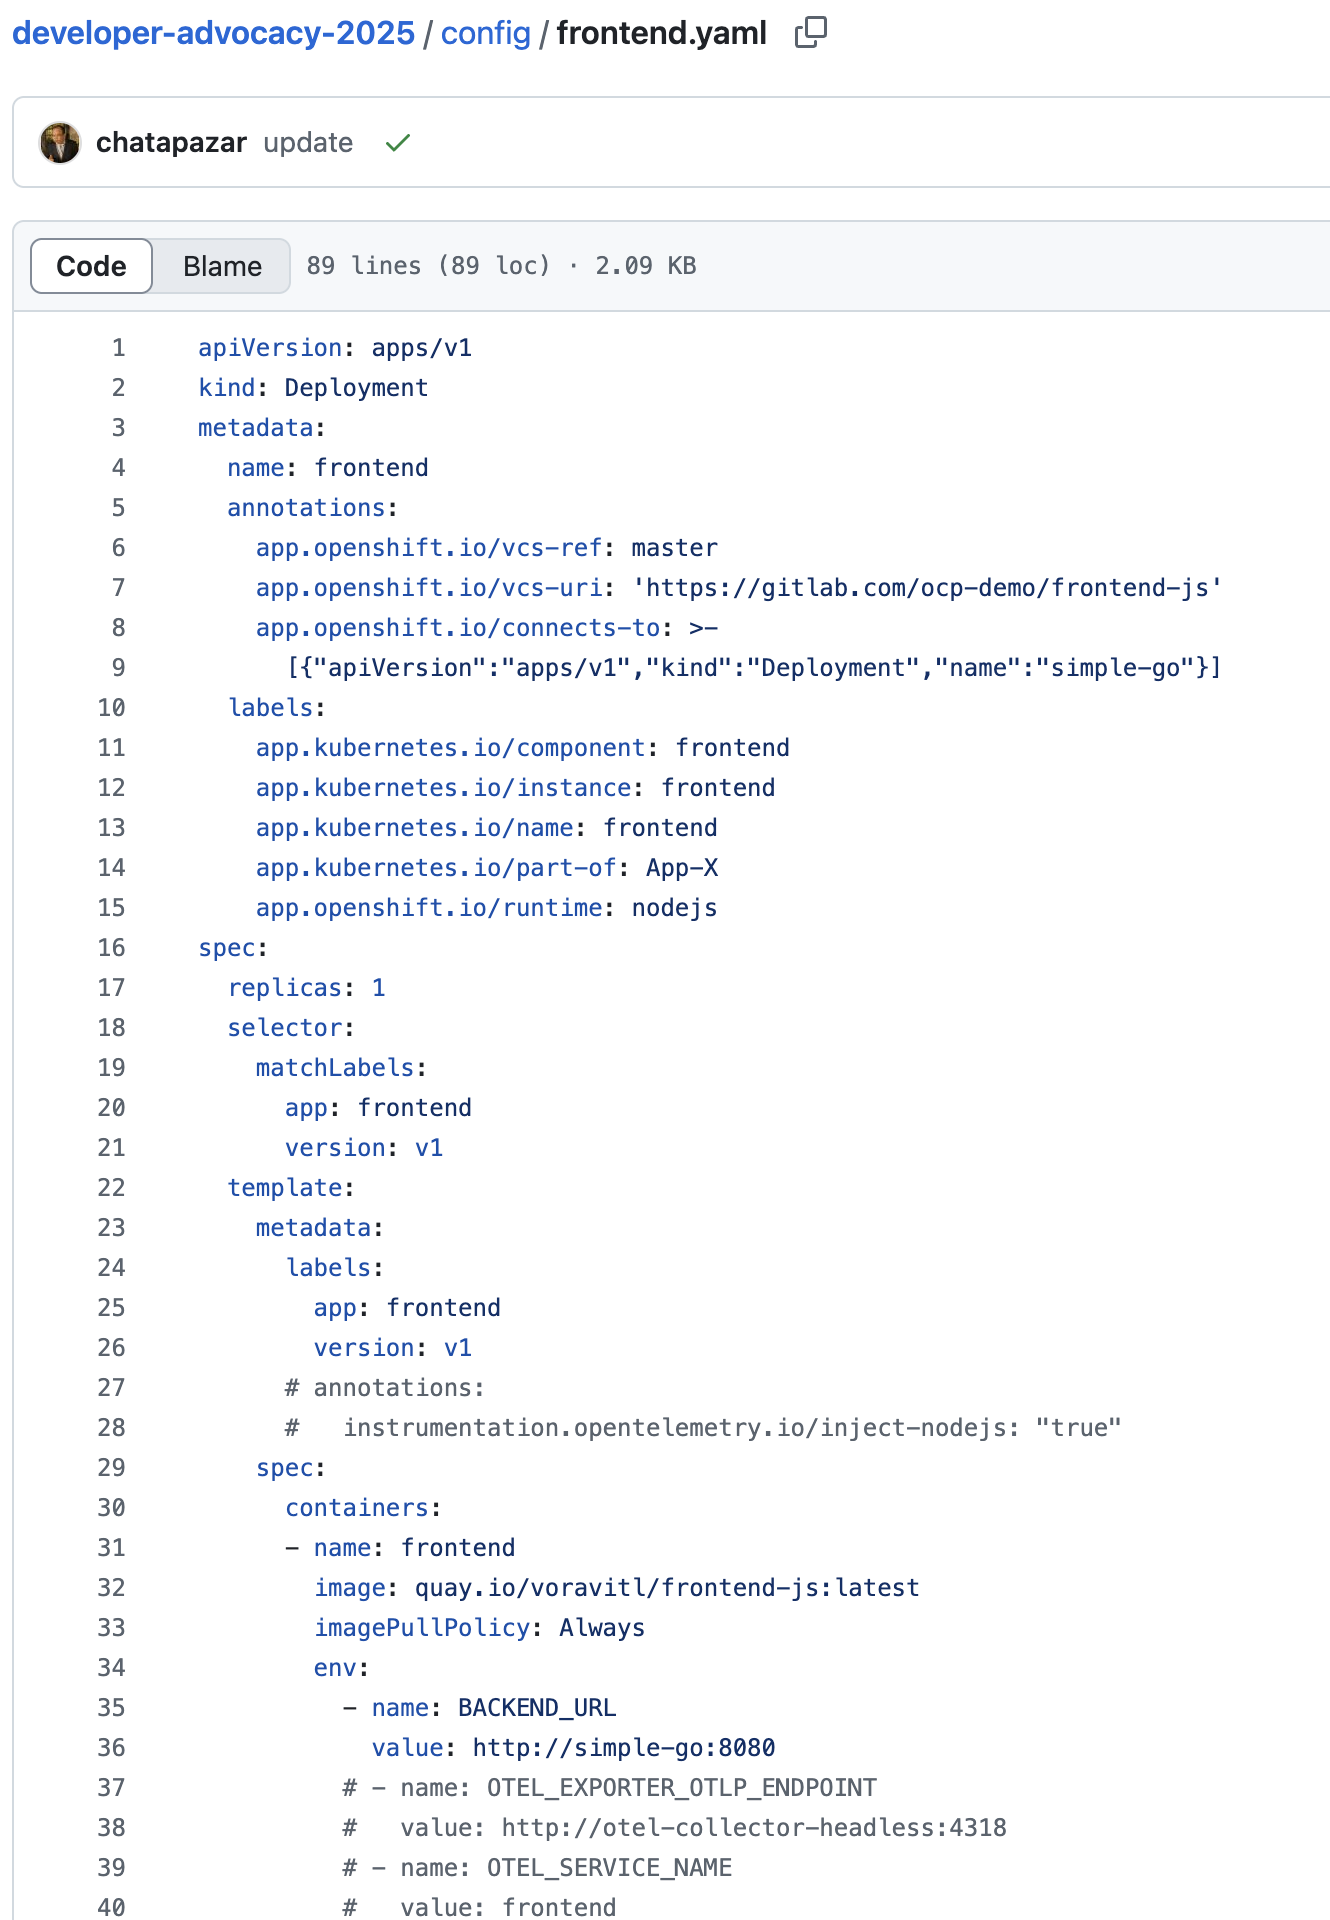
-
For the
Deploymentresource infrontend.yamlfile, you should see an environment variable namedBACKEND_URL, the value is thesimple-goapplication endpoint that thefrontendapplication will call to thesimple-goapplication via this URL.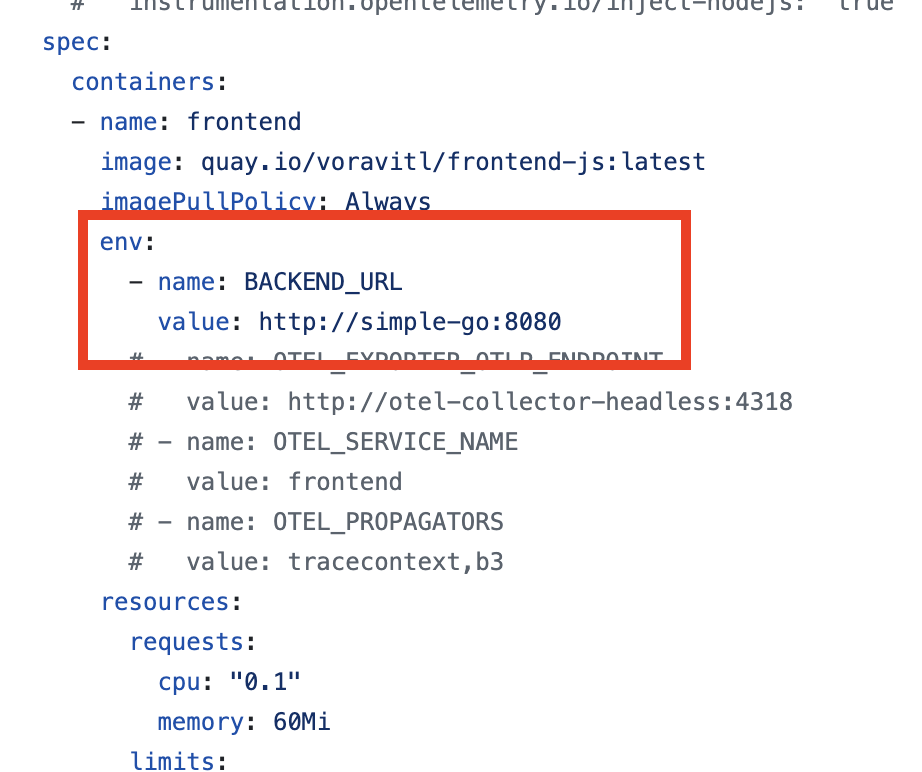
Application Codes
-
Go to https://gitlab.com/ocp-demo/backend_quarkus Git repository to see the
backendapplication code.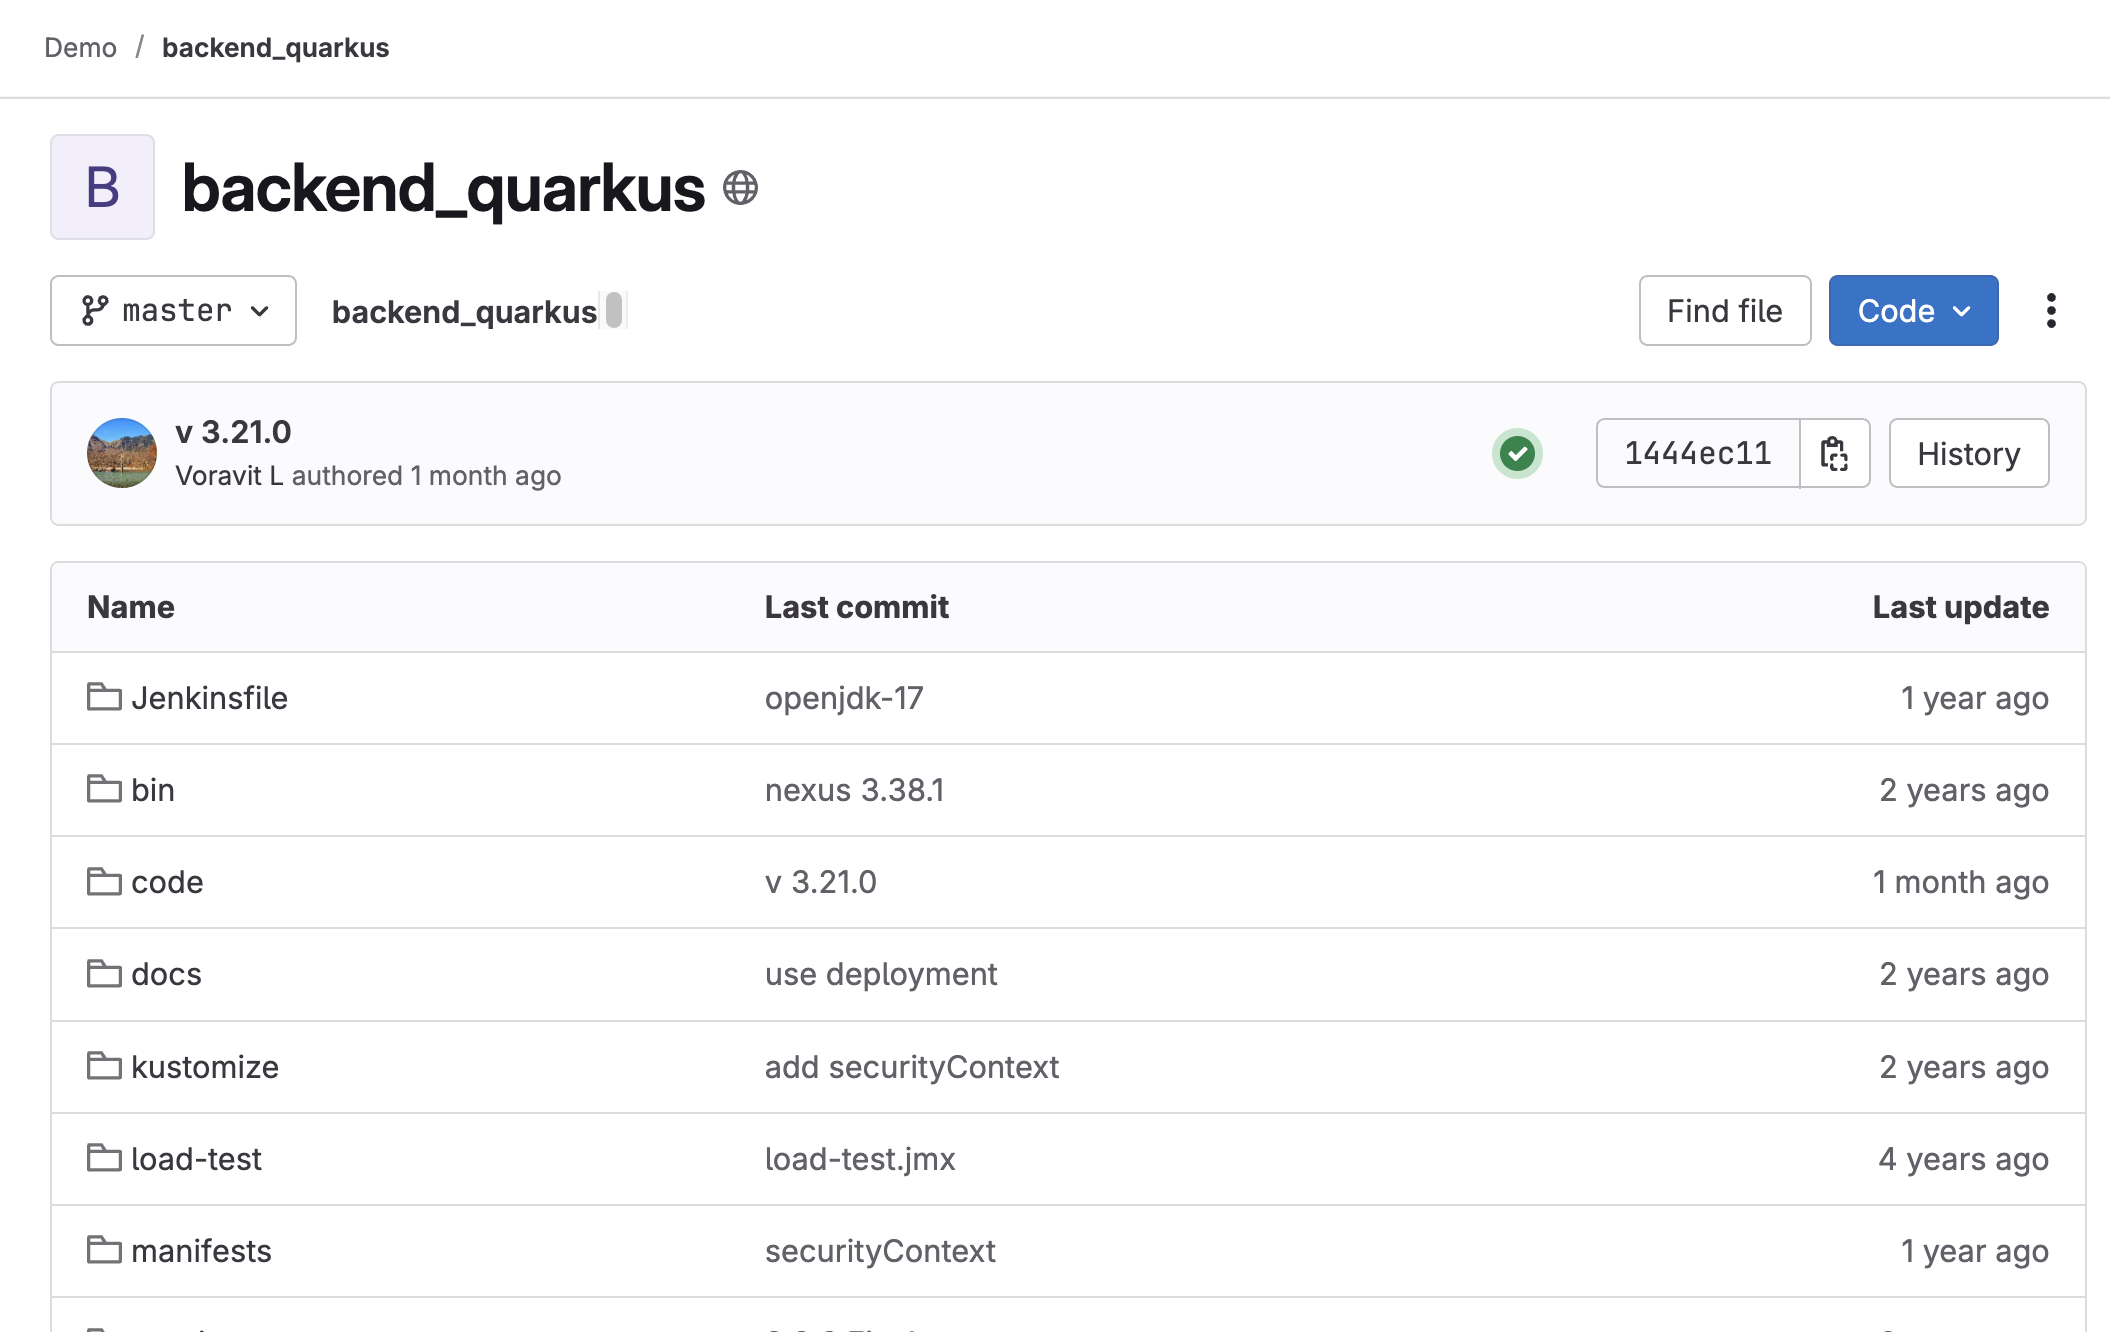
-
Open the
BackendResource.javafile in/code/src/main/java/com/example/quarkusdirectory. Then search forlogger.info- these lines of code will print log messages tostdout(Standard output).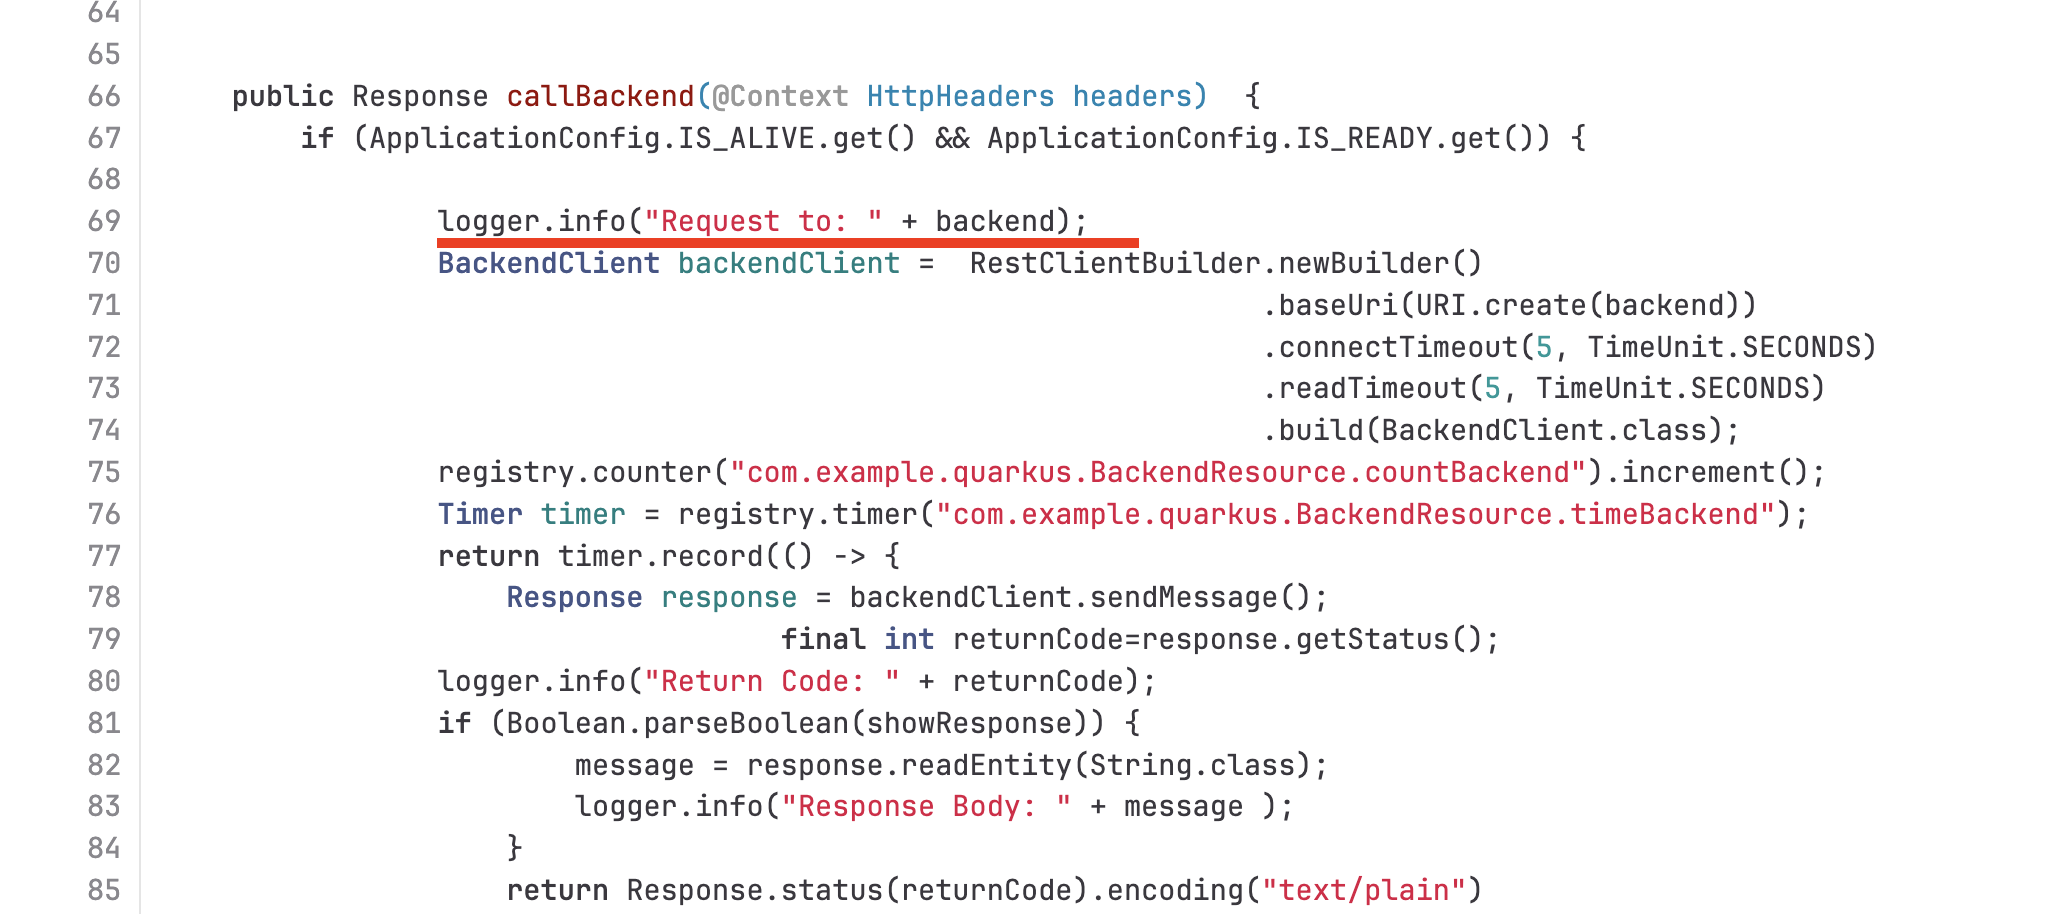
-
Go to https://github.com/rhthsa/simple-rest-go Git repository to see the
simple-goapplication code.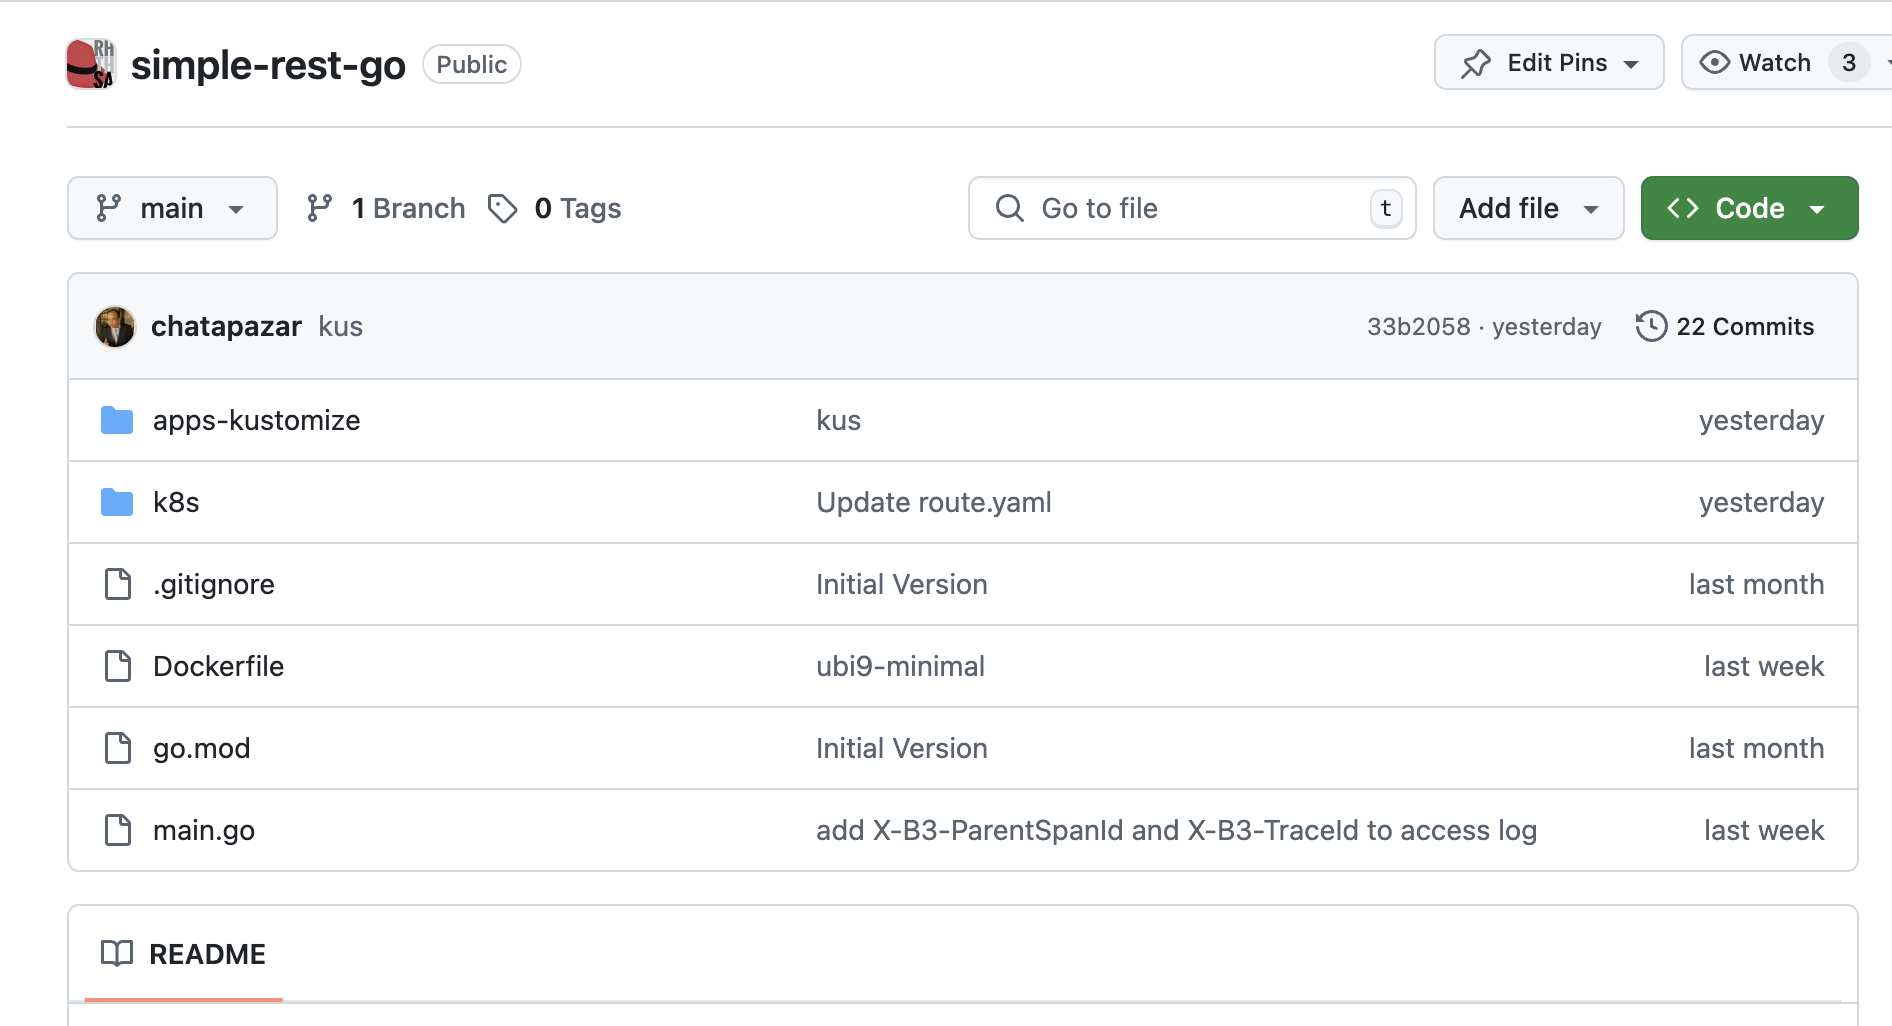
-
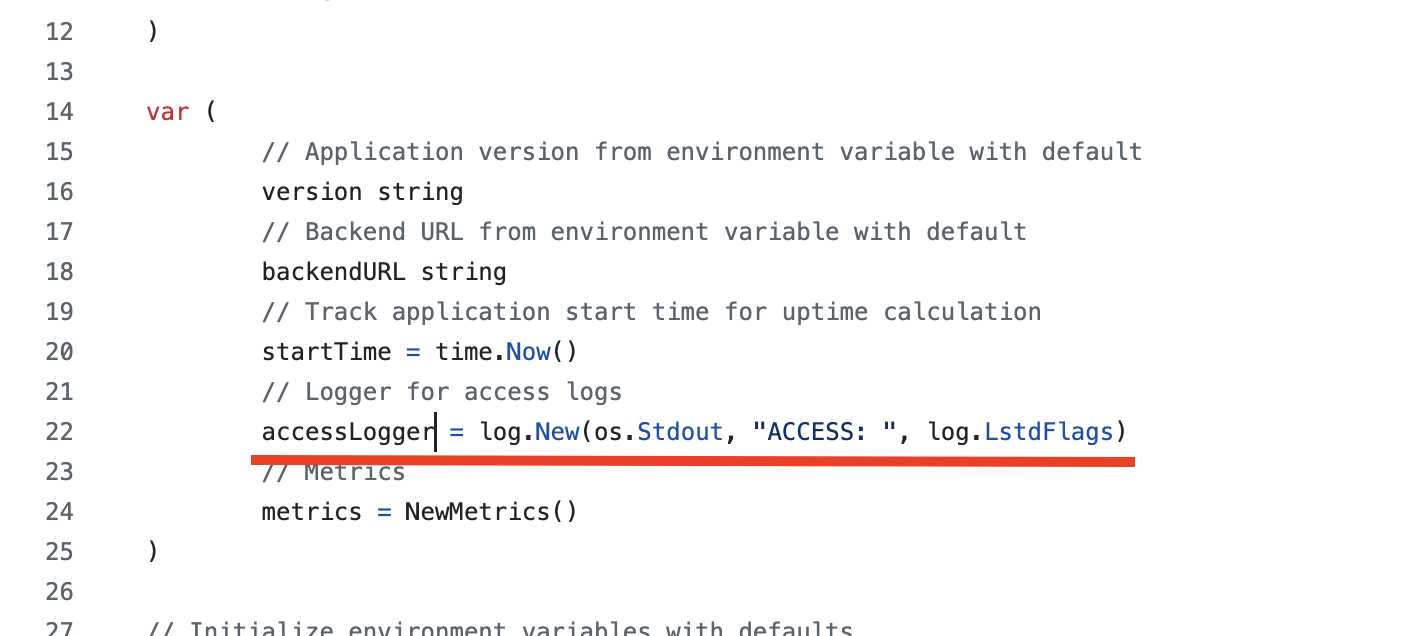
Open the
main.gofile, seach forlog.PrintfandaccessLogger.Printf- these codes will print log messages tostdout.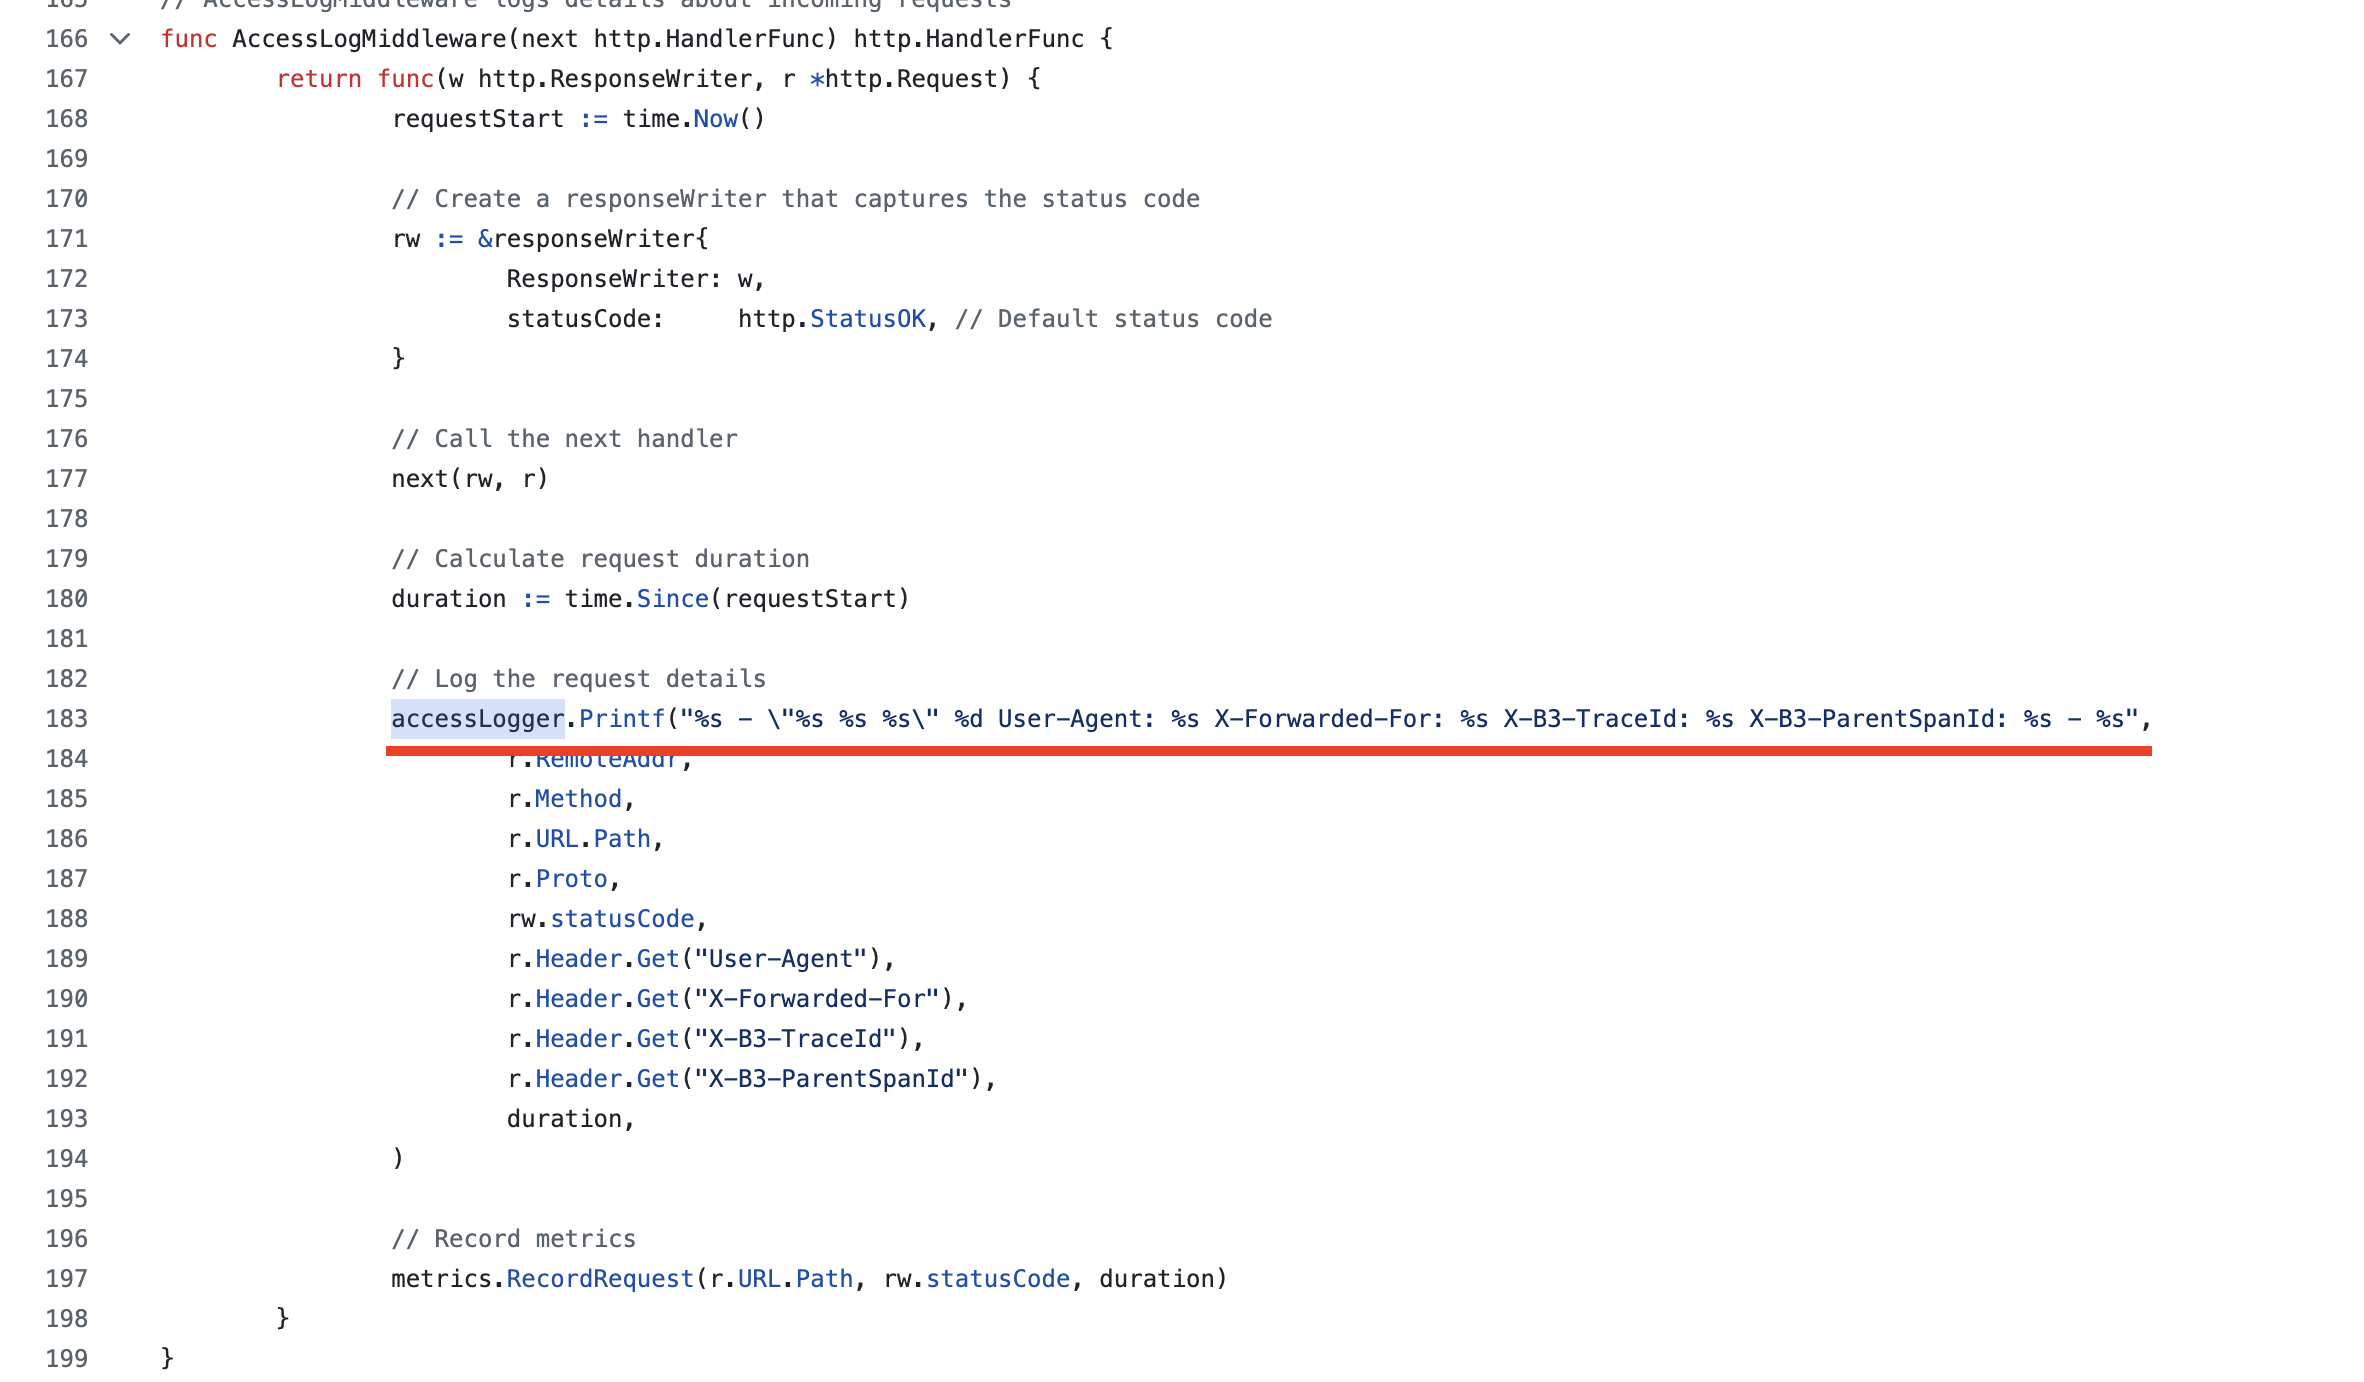
-
Go to https://gitlab.com/ocp-demo/frontend-js Git repository to see the
frontendapplication code.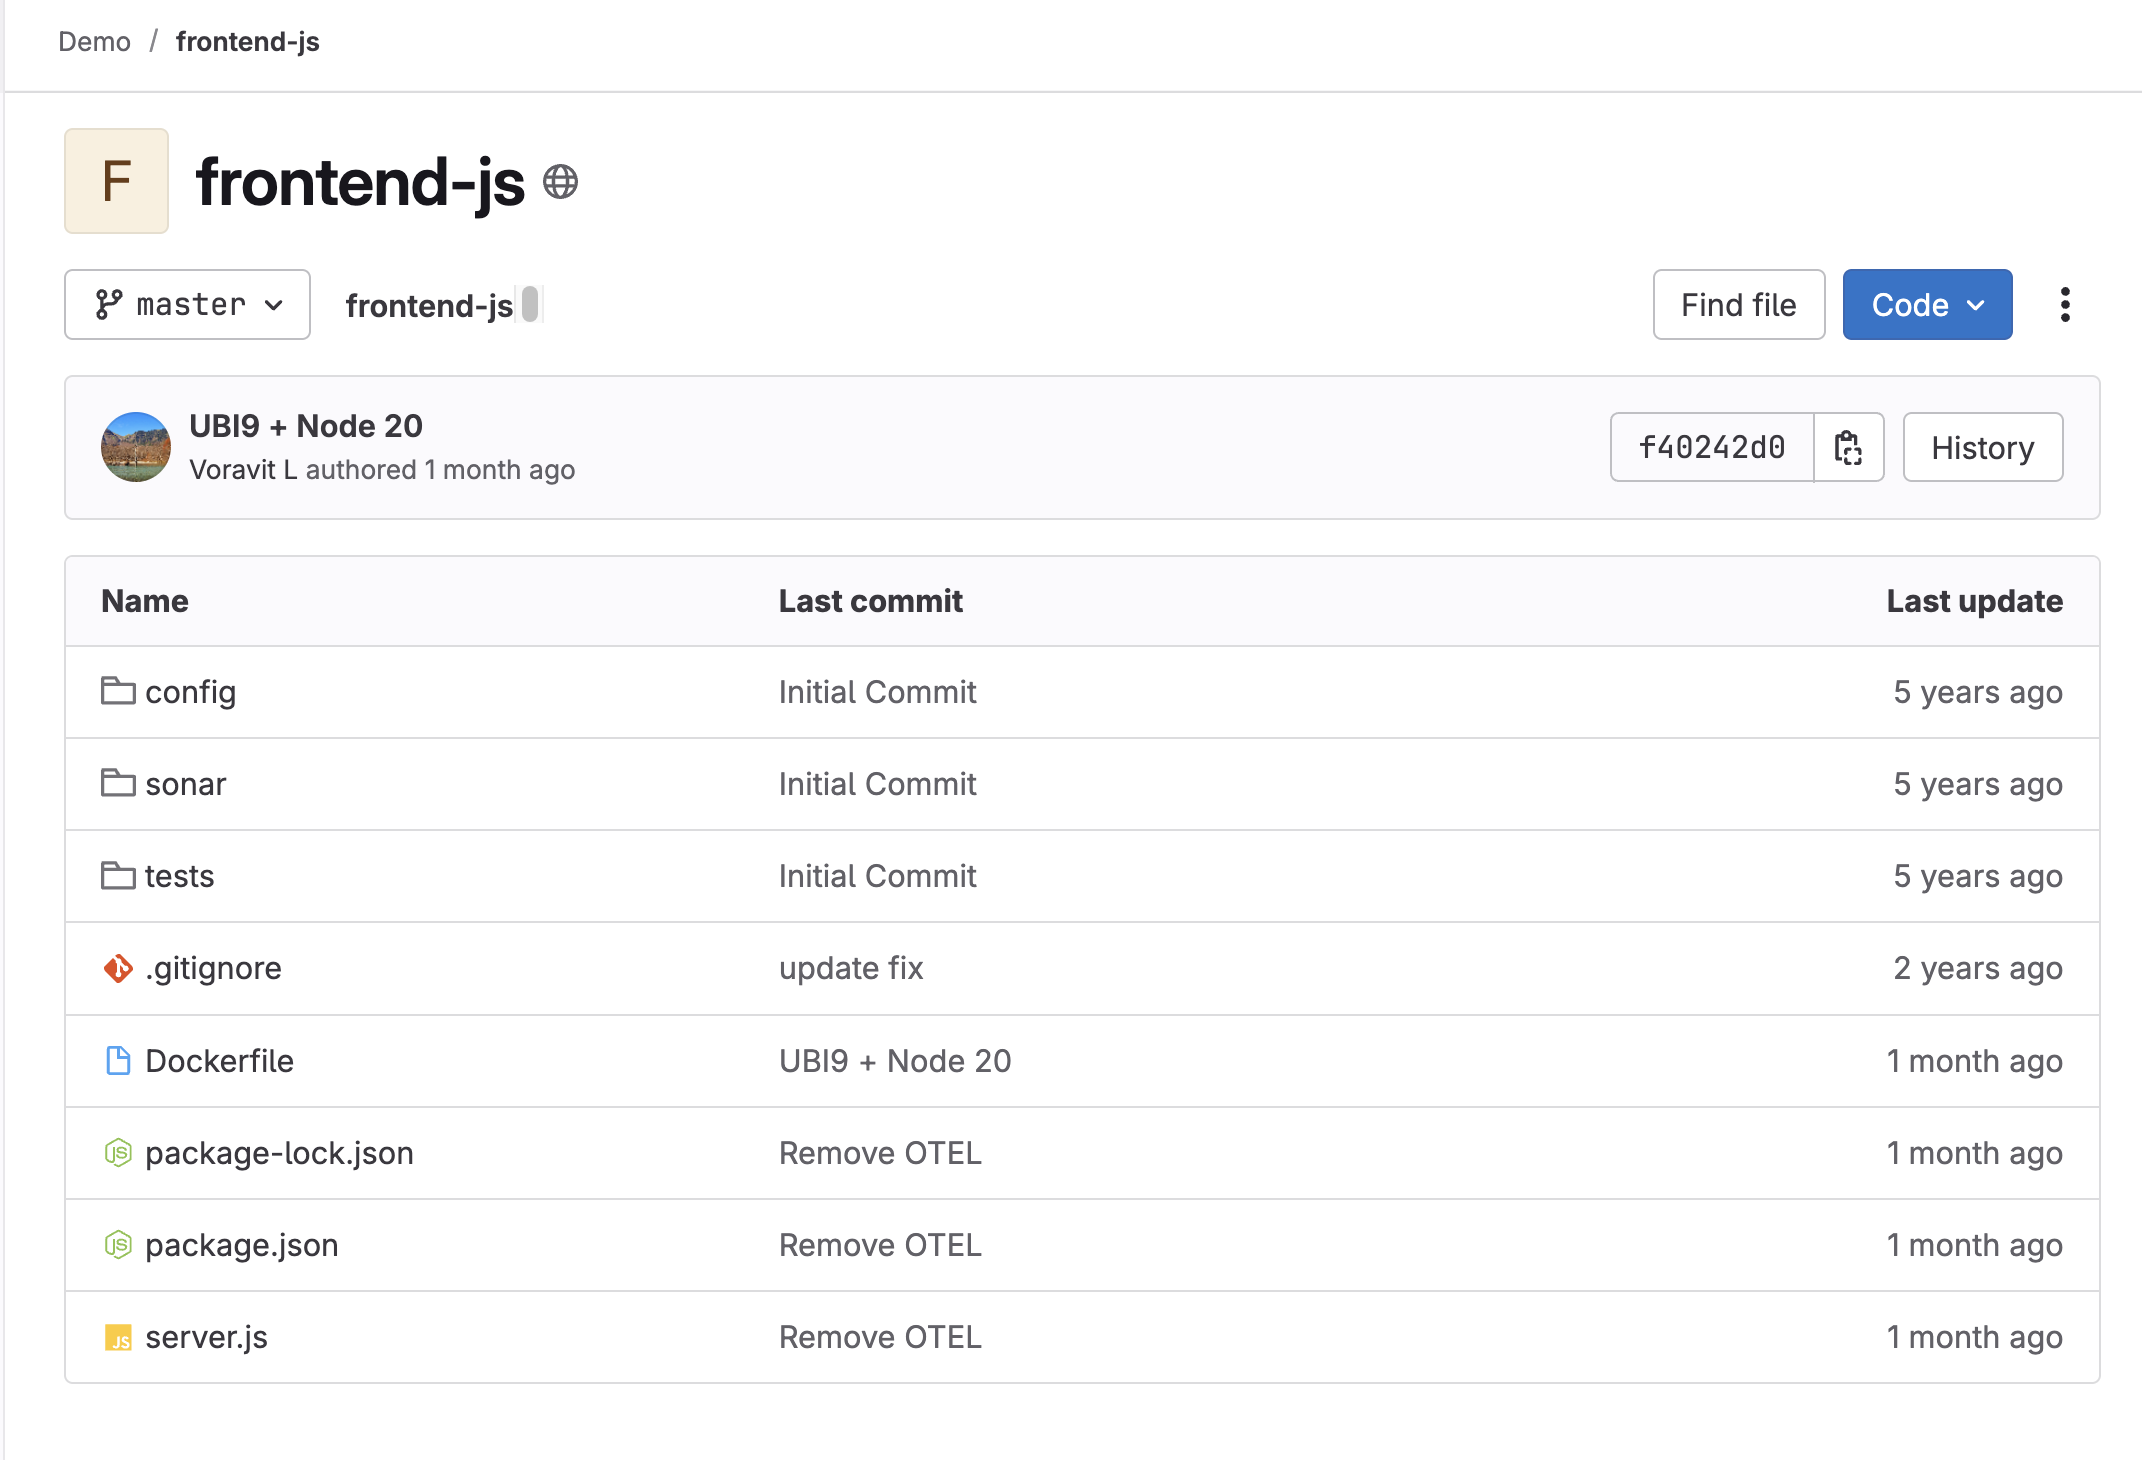
-
Open the
server.jsfile, search forlogger.info- these lines of code will print log messages tostdout.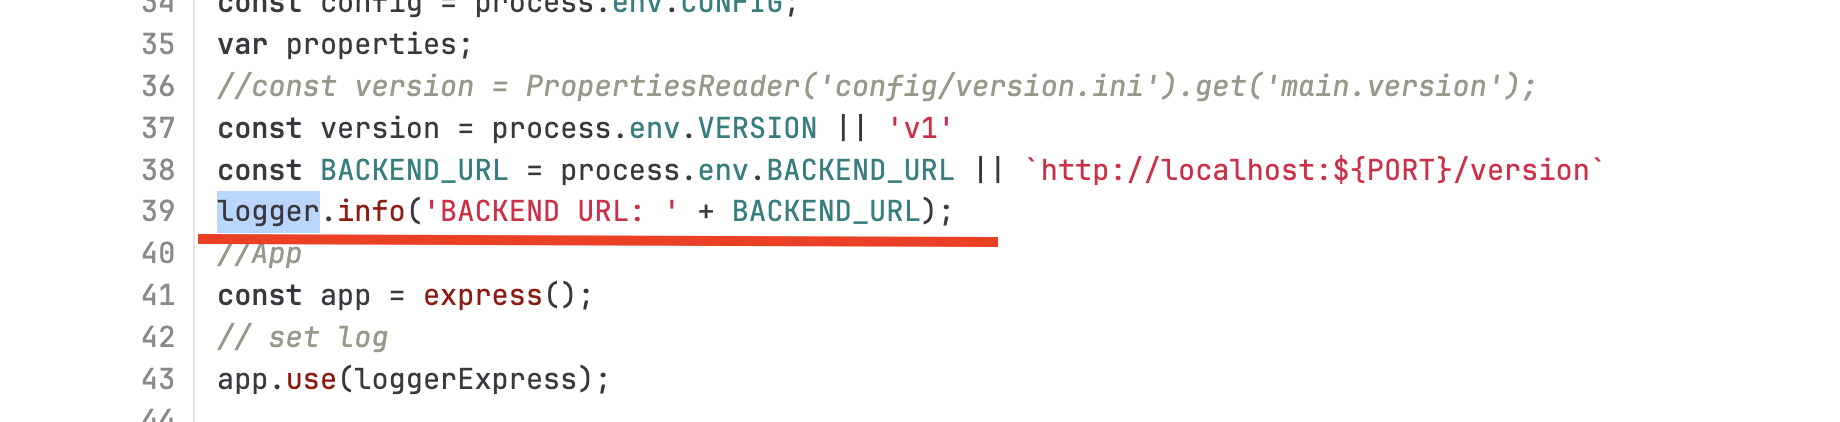
Deploy Sample Applications
Next, we’re going to deploy those 3 applications we’ve reviewed the codes and deployment configurations. We’ll deploy the applications using the deployment configurations defined as YAML in the *.yaml files we’ve seen earlier.
-
In OpenShift console, change to
userX-observeproject that matches to your username.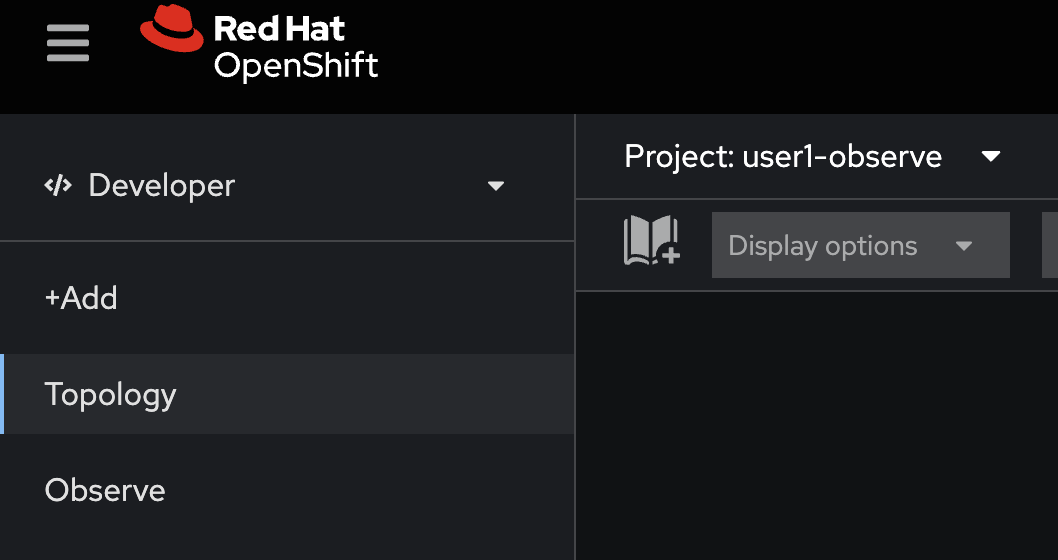
-
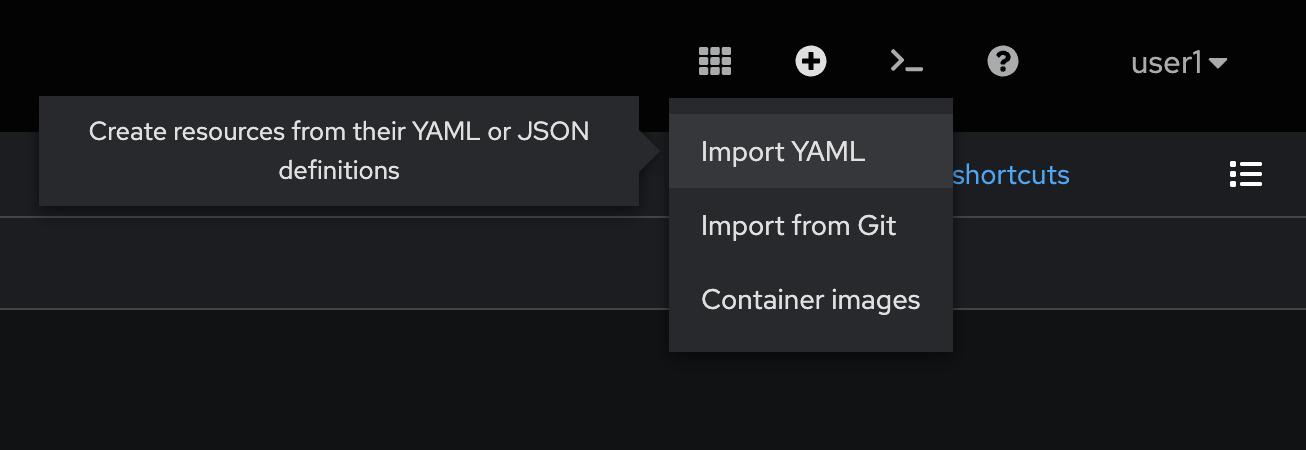
Click on the + button at the top right corner of console, then select Import YAML.
-
Copy all YAML code from
backend.yamlfile in https://github.com/rhthsa/developer-advocacy-2025/tree/main/config and paste to YAML editor in OpenShift console.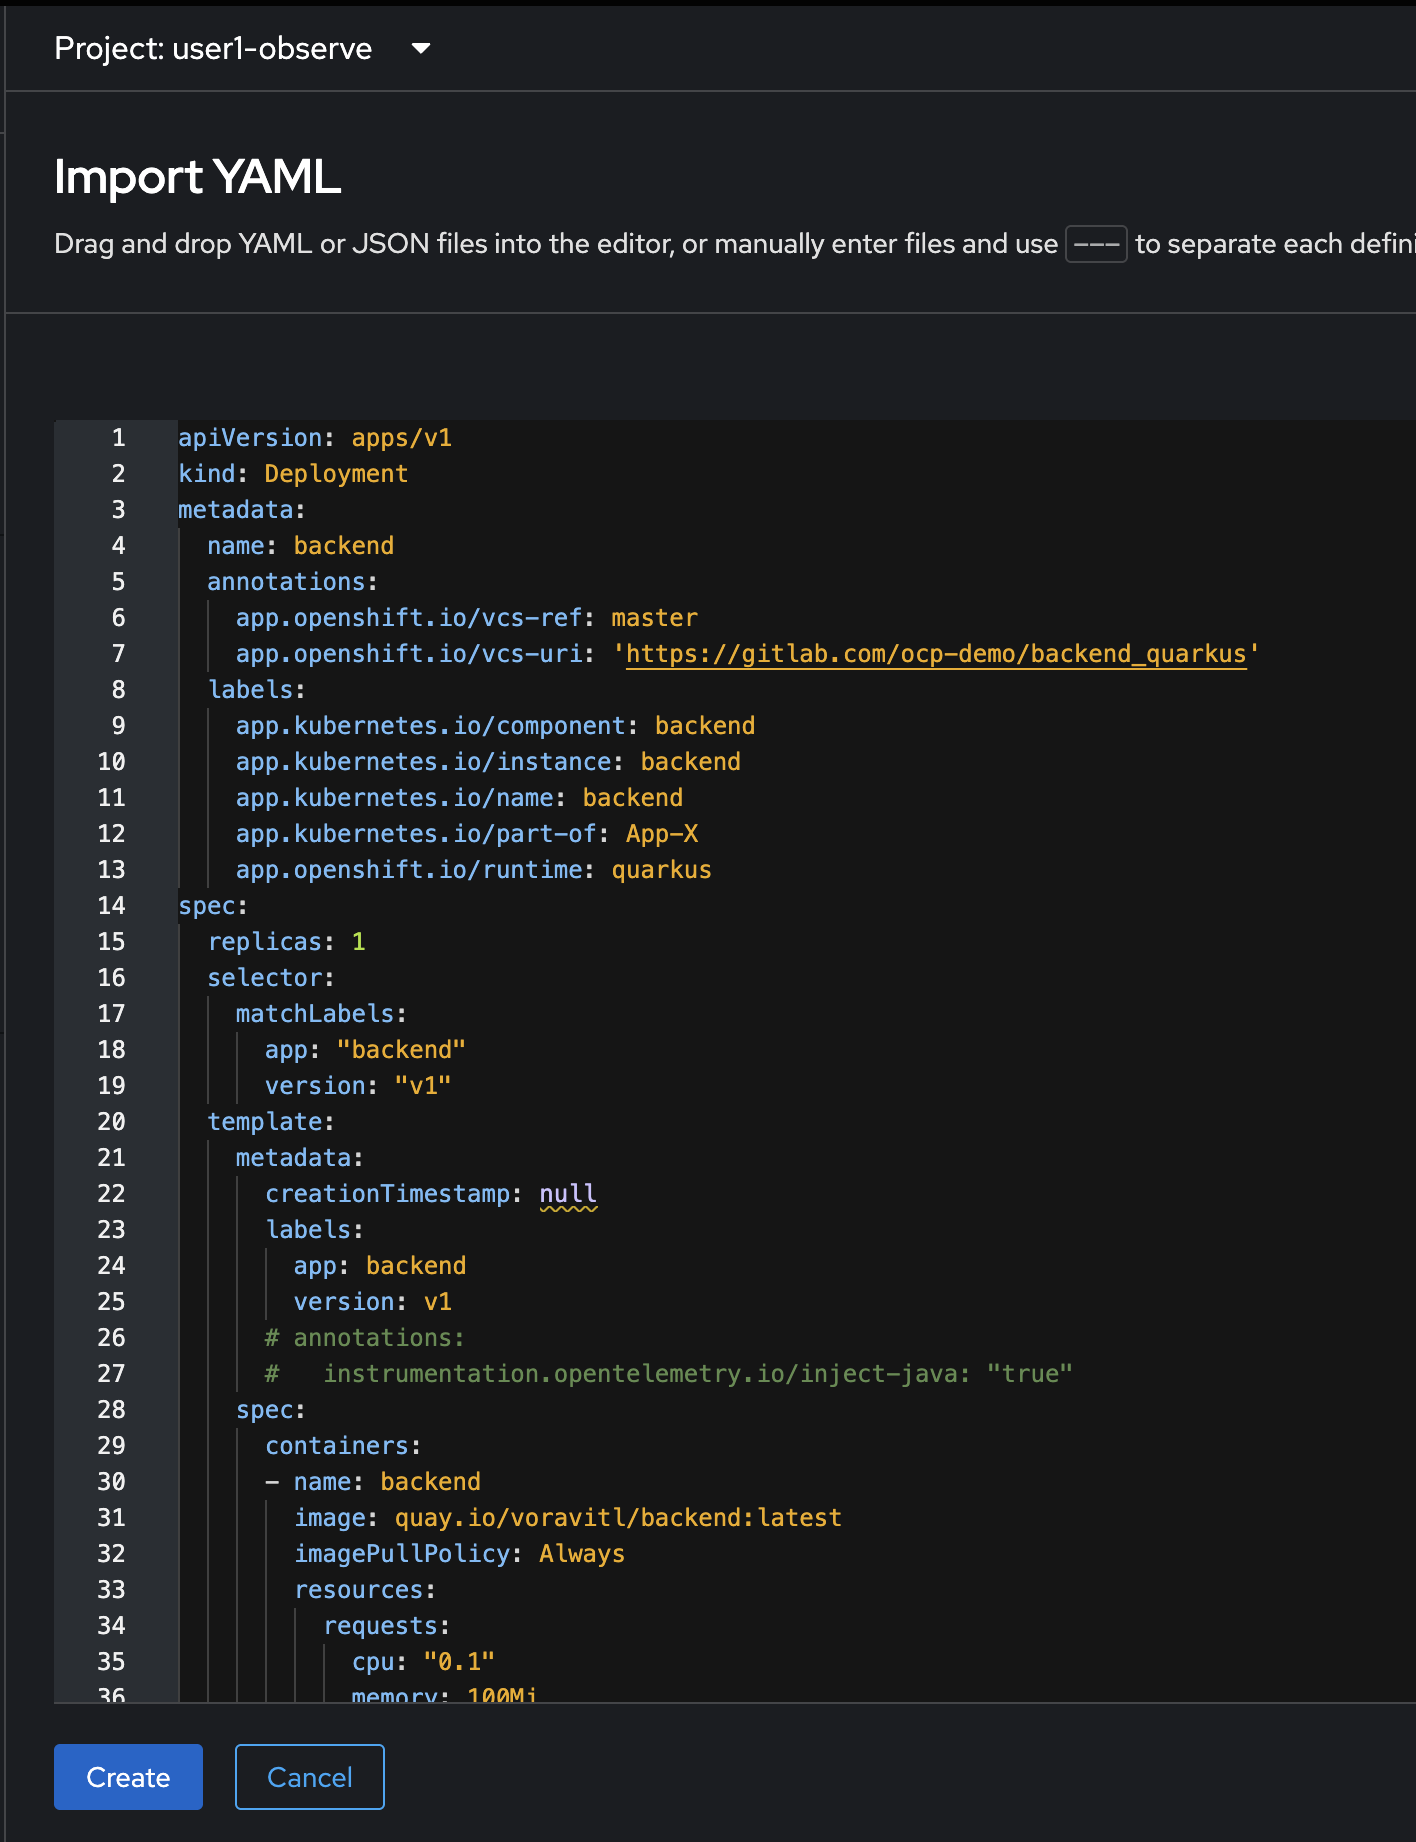
-
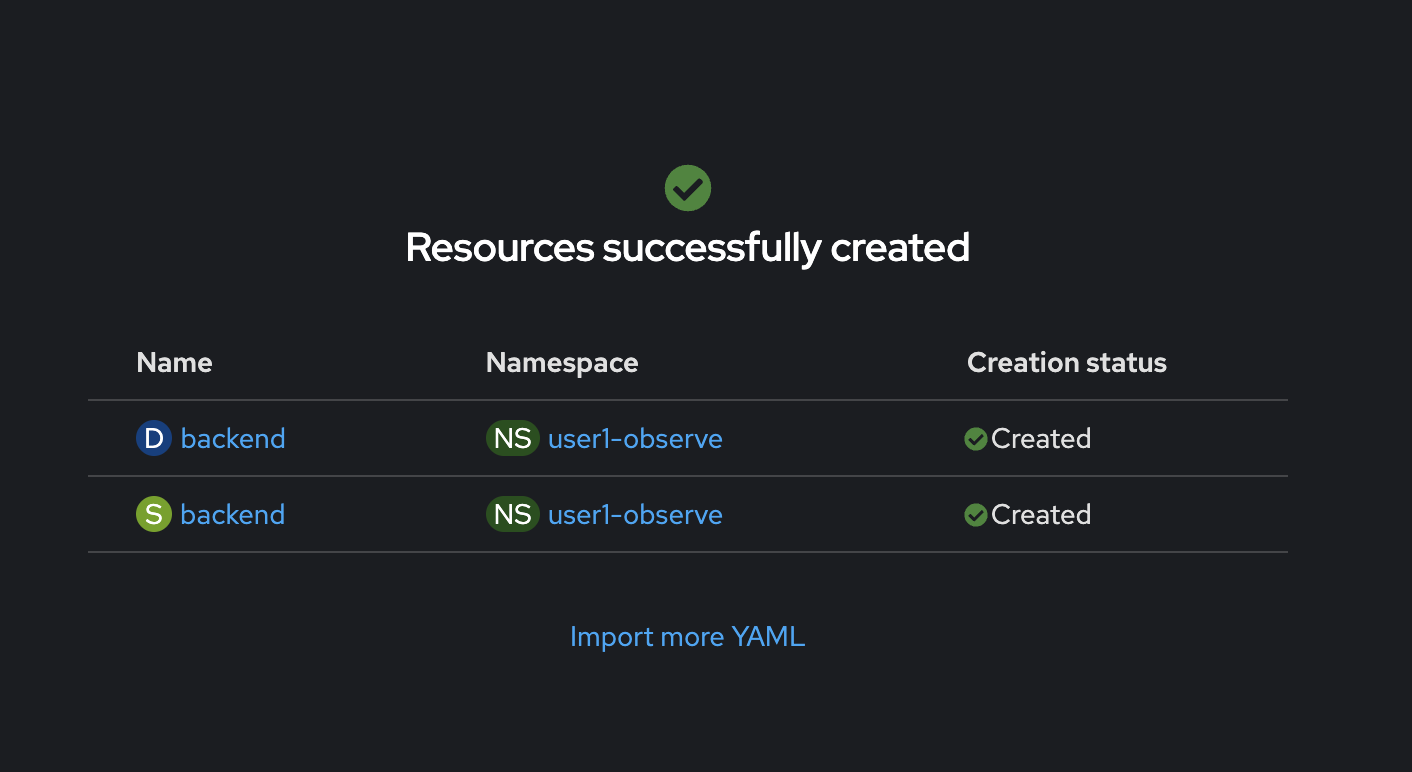
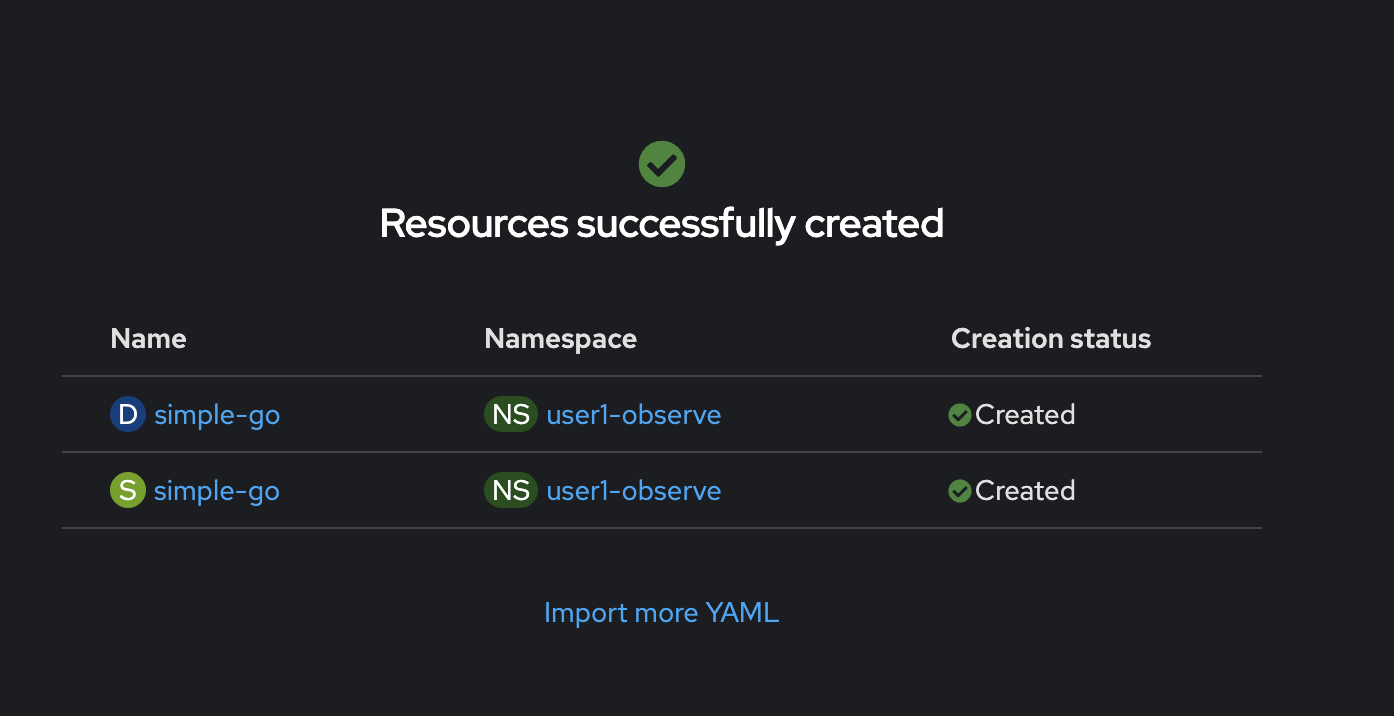
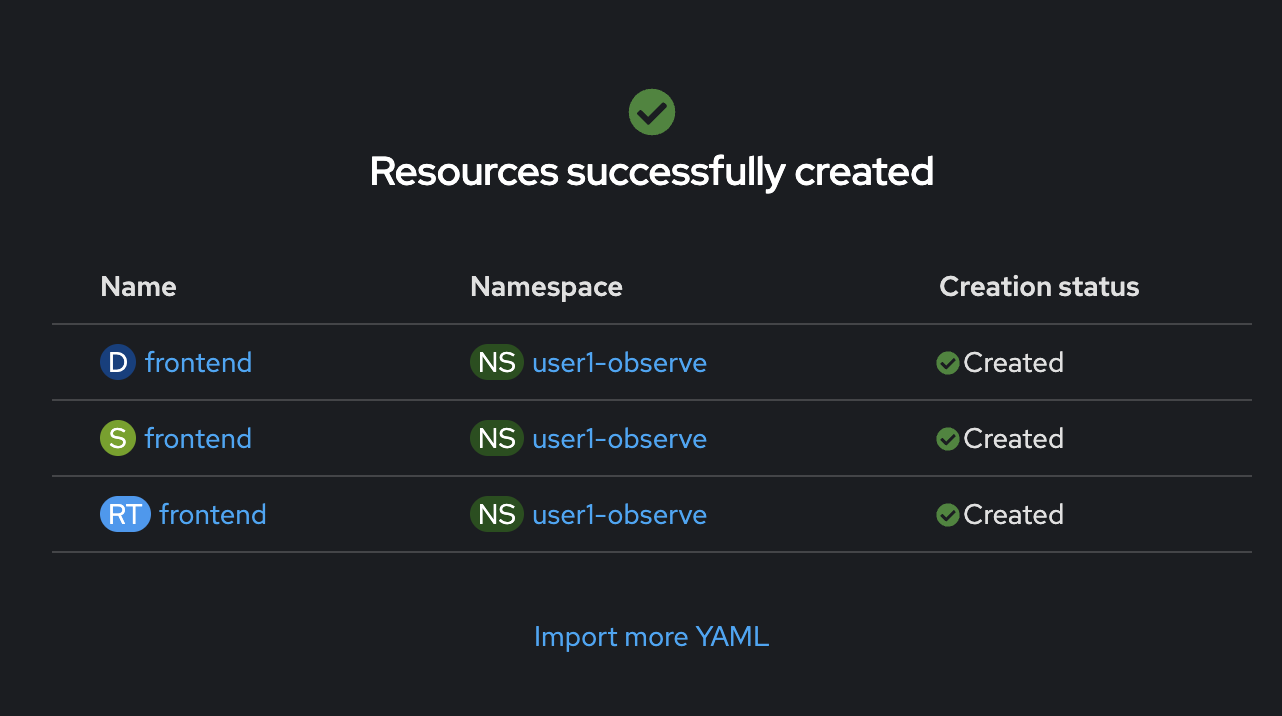
Click Create, and wait util all resources created successfully.
-
Select Topology menu on the left. The
backendDeployment should appear.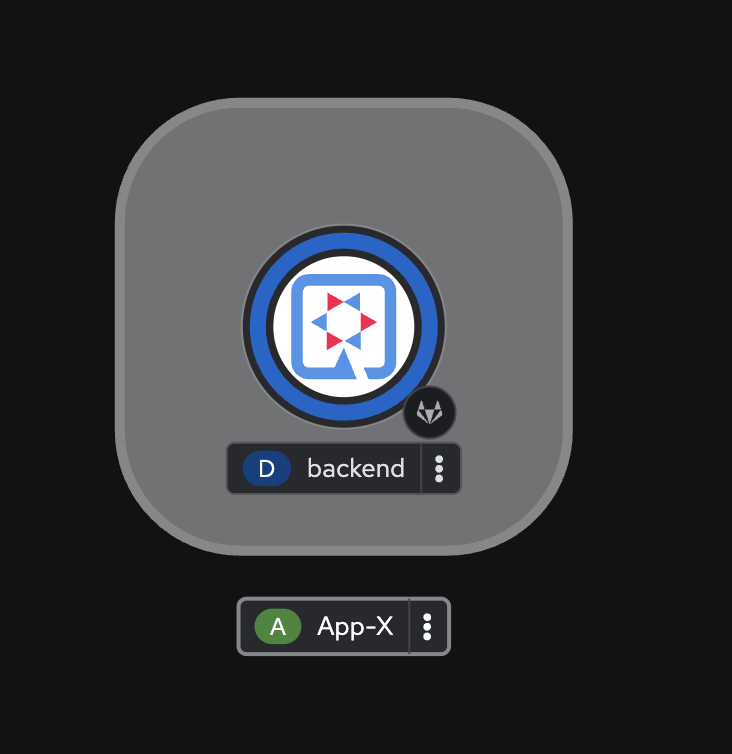
-
Click on the + button at the top right corner of console, then select Import YAML. Copy all YAML code from
simple-go.yamlfile in https://github.com/rhthsa/developer-advocacy-2025/tree/main/config and paste to YAML editor in OpenShift console.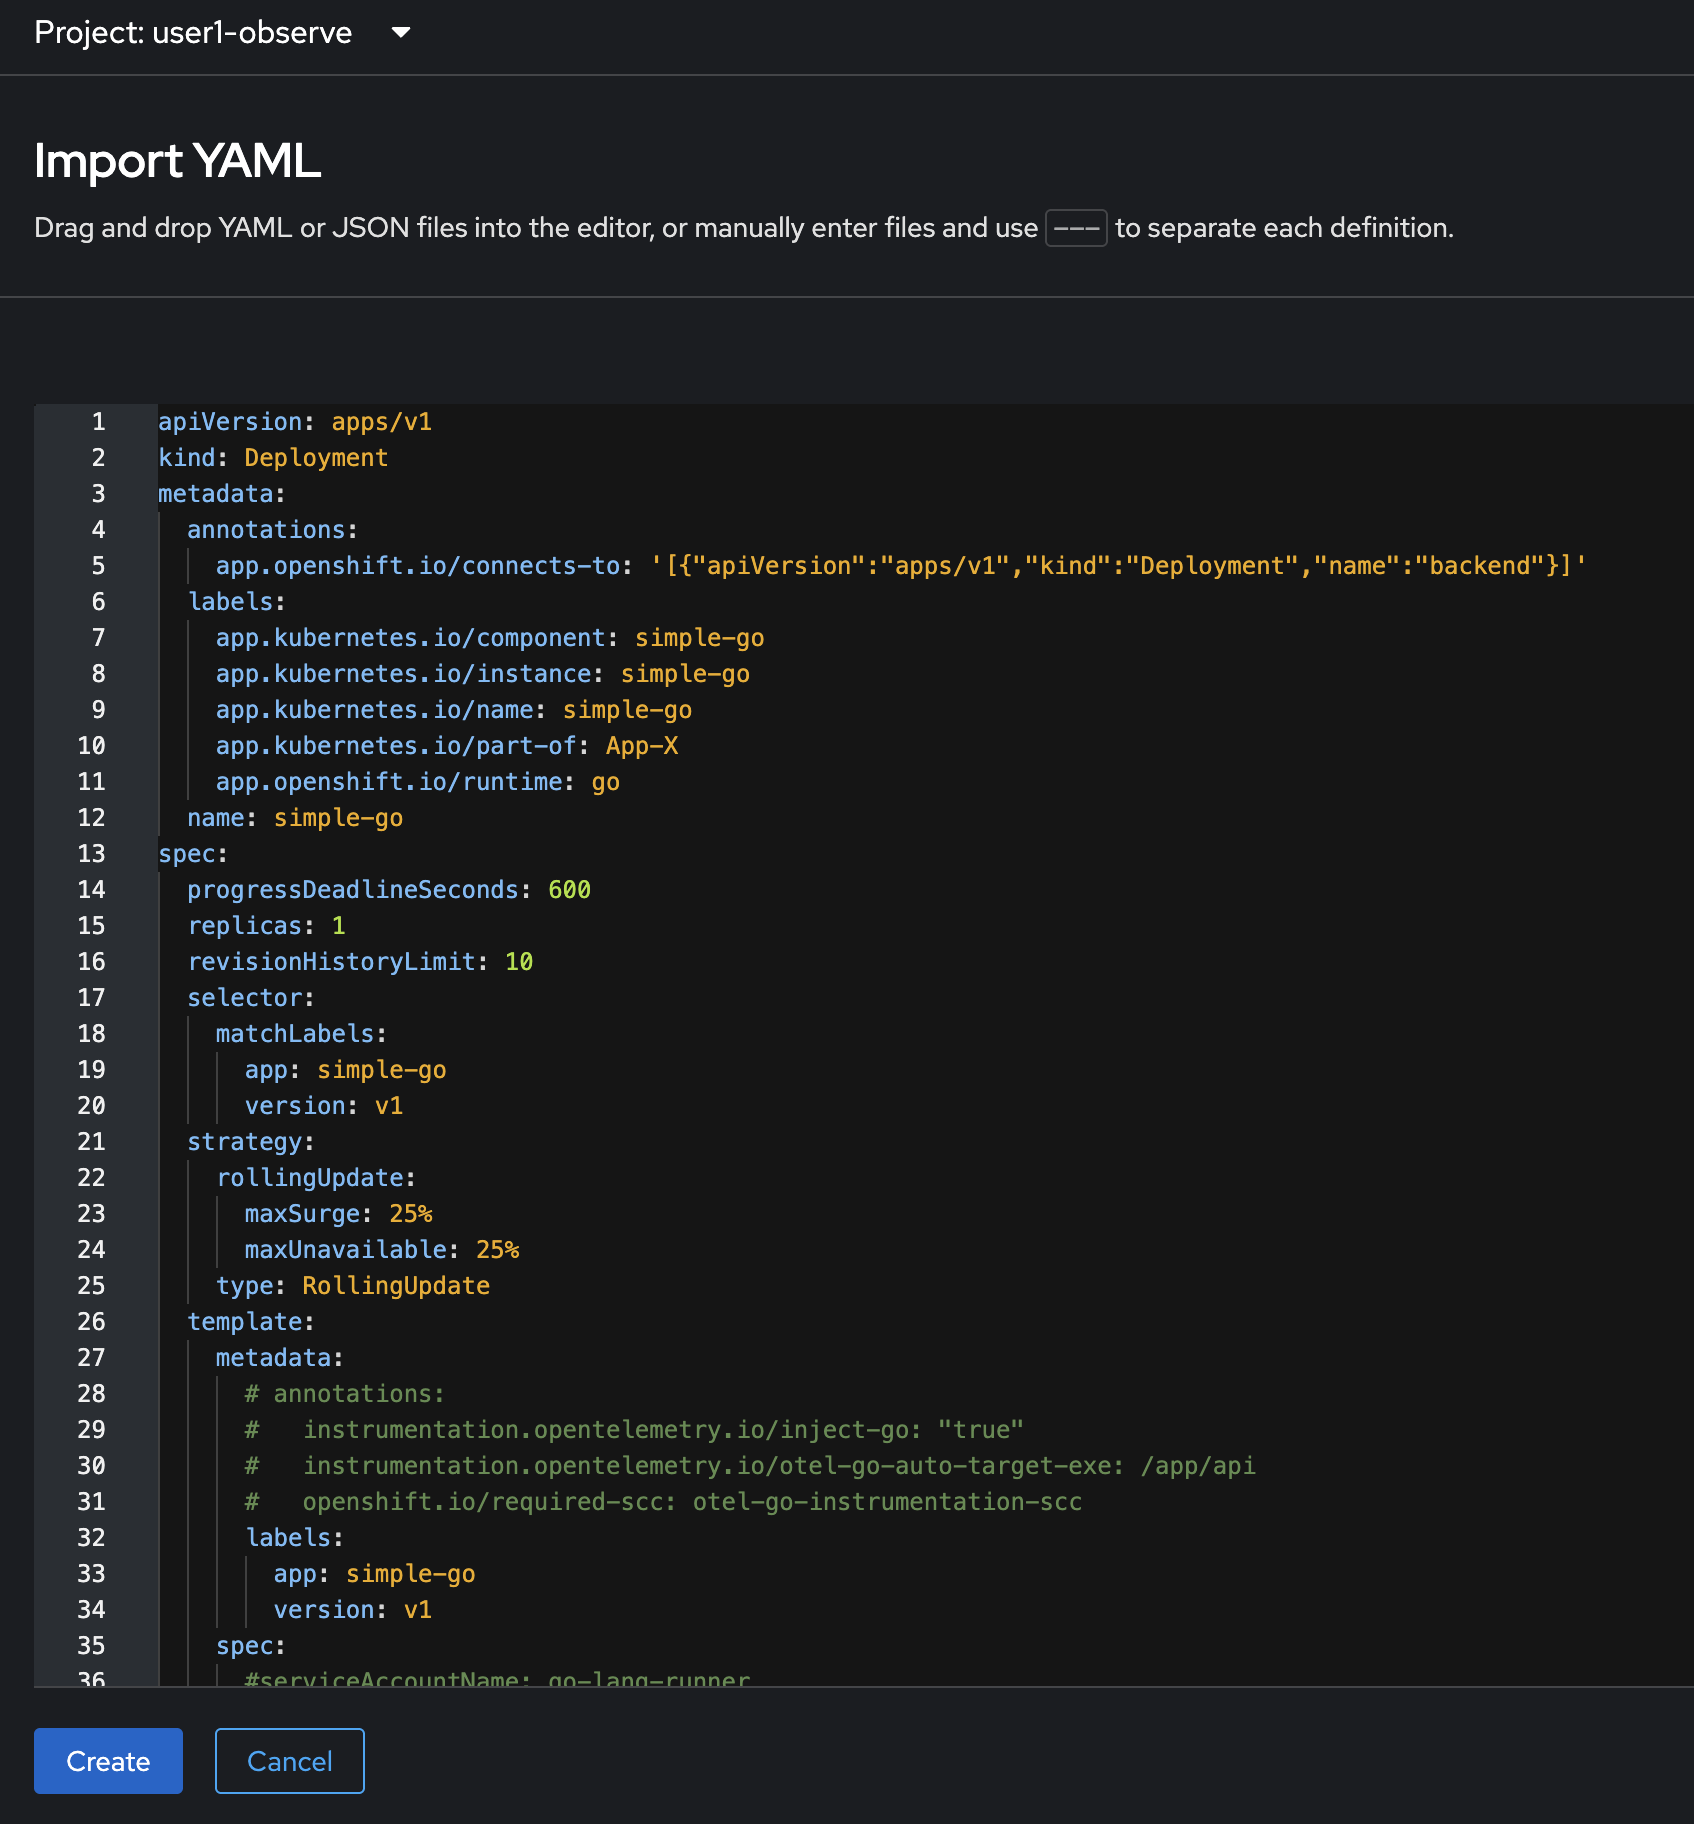
-
click Create, and wait util all resources created successfully.
-
Select Topology menu on the left. The
simple-goDeployment should appear.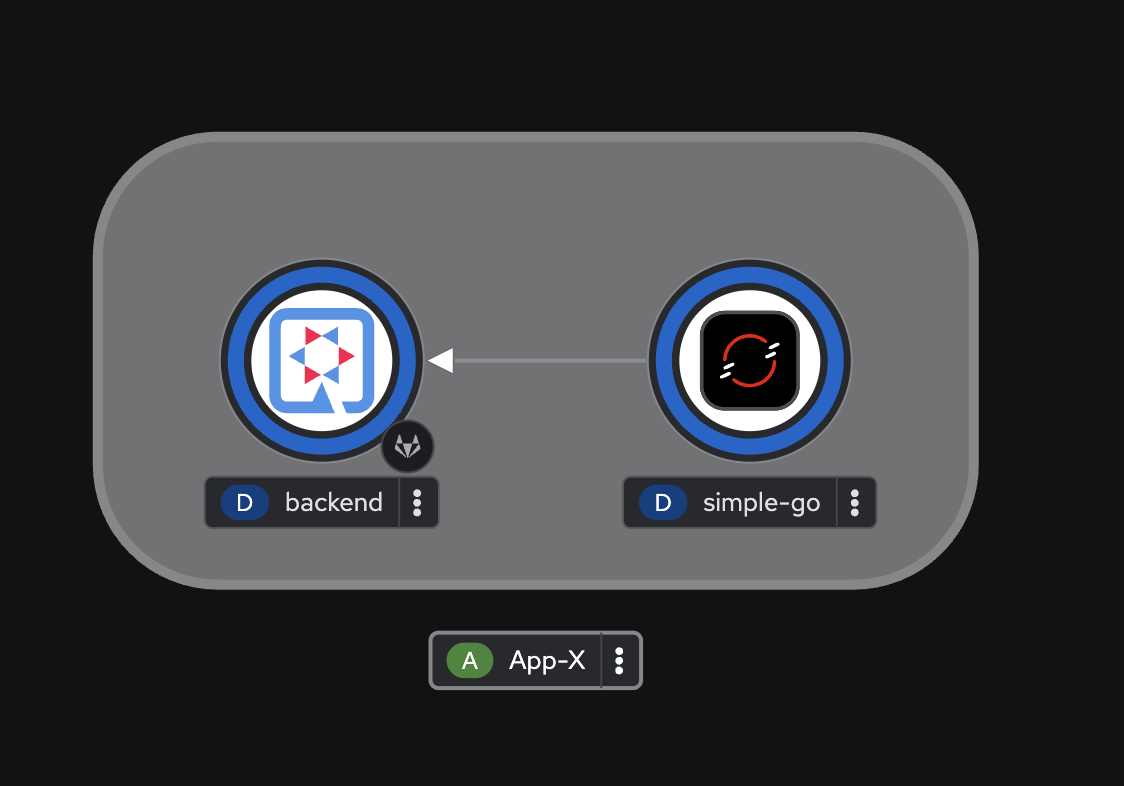
-
Click on the + button at the top right corner of console, then select Import YAML. Copy all YAML code from
frontend.yamlfile in https://github.com/rhthsa/developer-advocacy-2025/tree/main/config and paste to YAML editor in OpenShift console.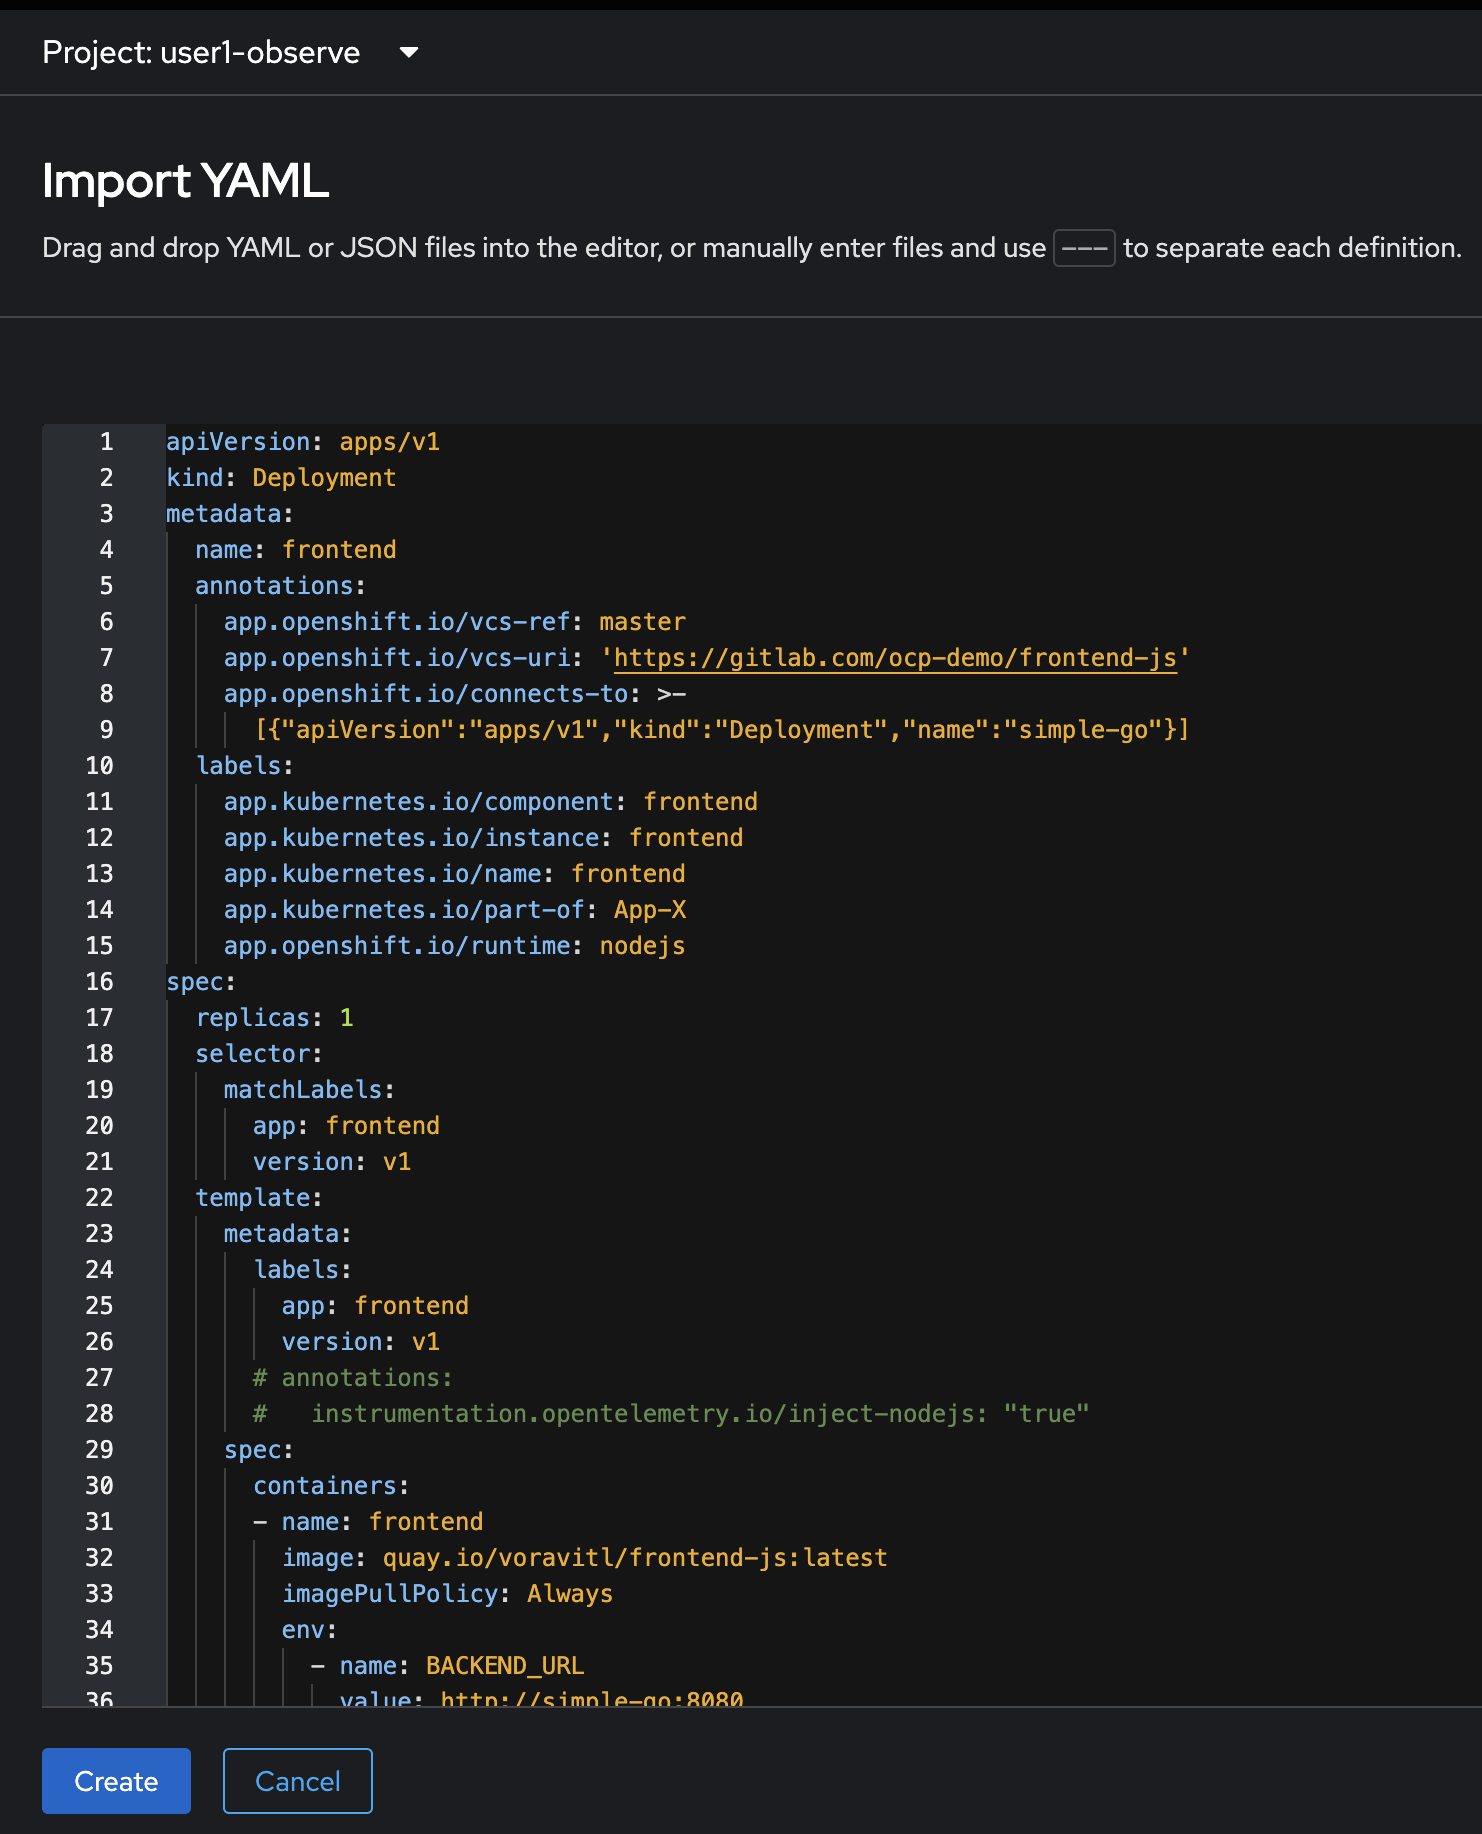
-
click Create, and wait util all resources created successfully.
-
Select Topology menu on the left. The
frontendDeployment should appear.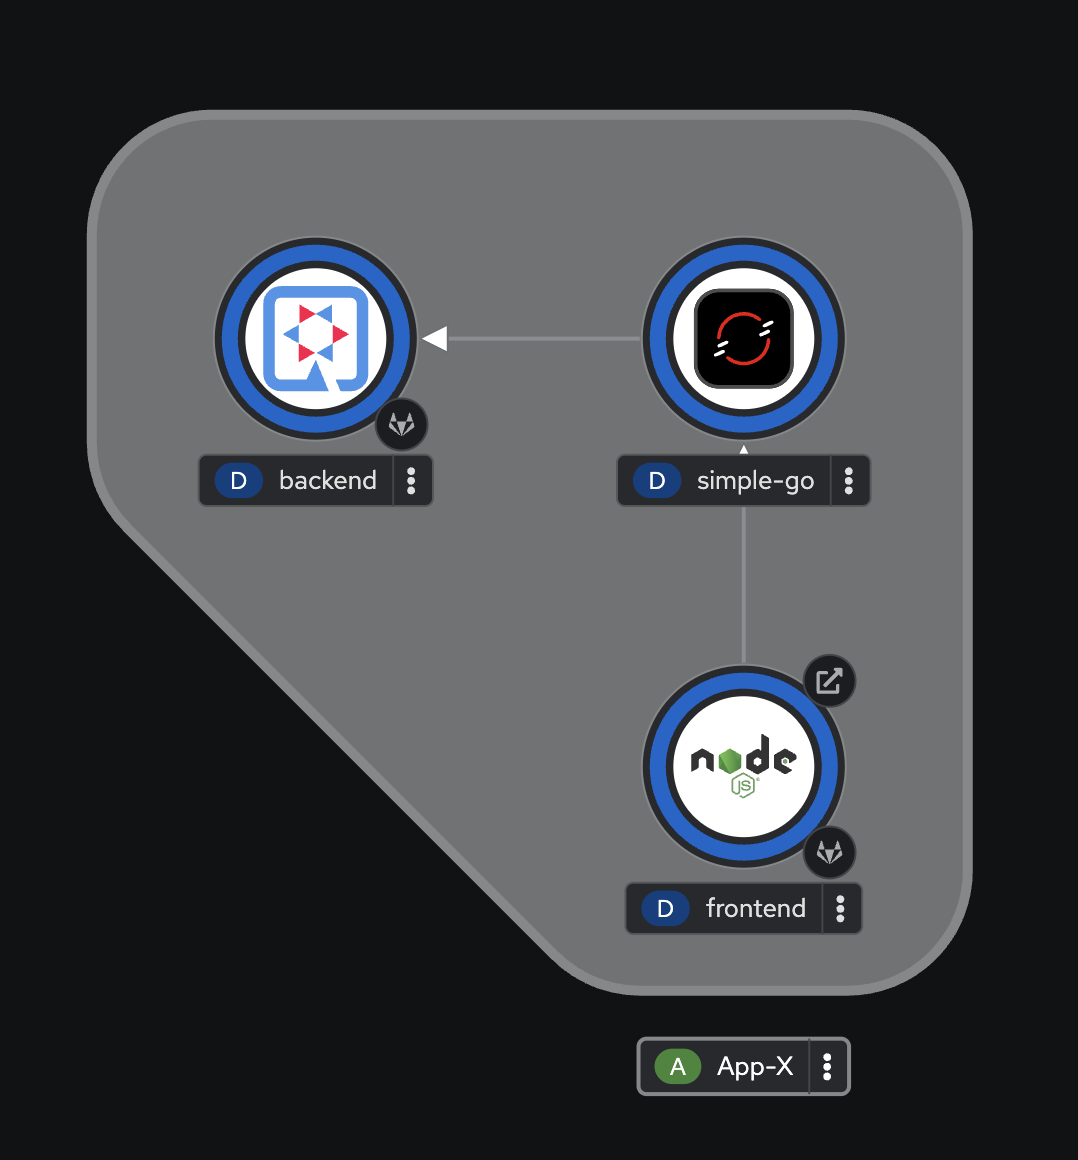
View Individual Application Logs
-
Select the
backendDeployment, go to the Resources tab on the right panel, then right click on the View logs link and select Open Link in New Tab to view application logs in a separated tab.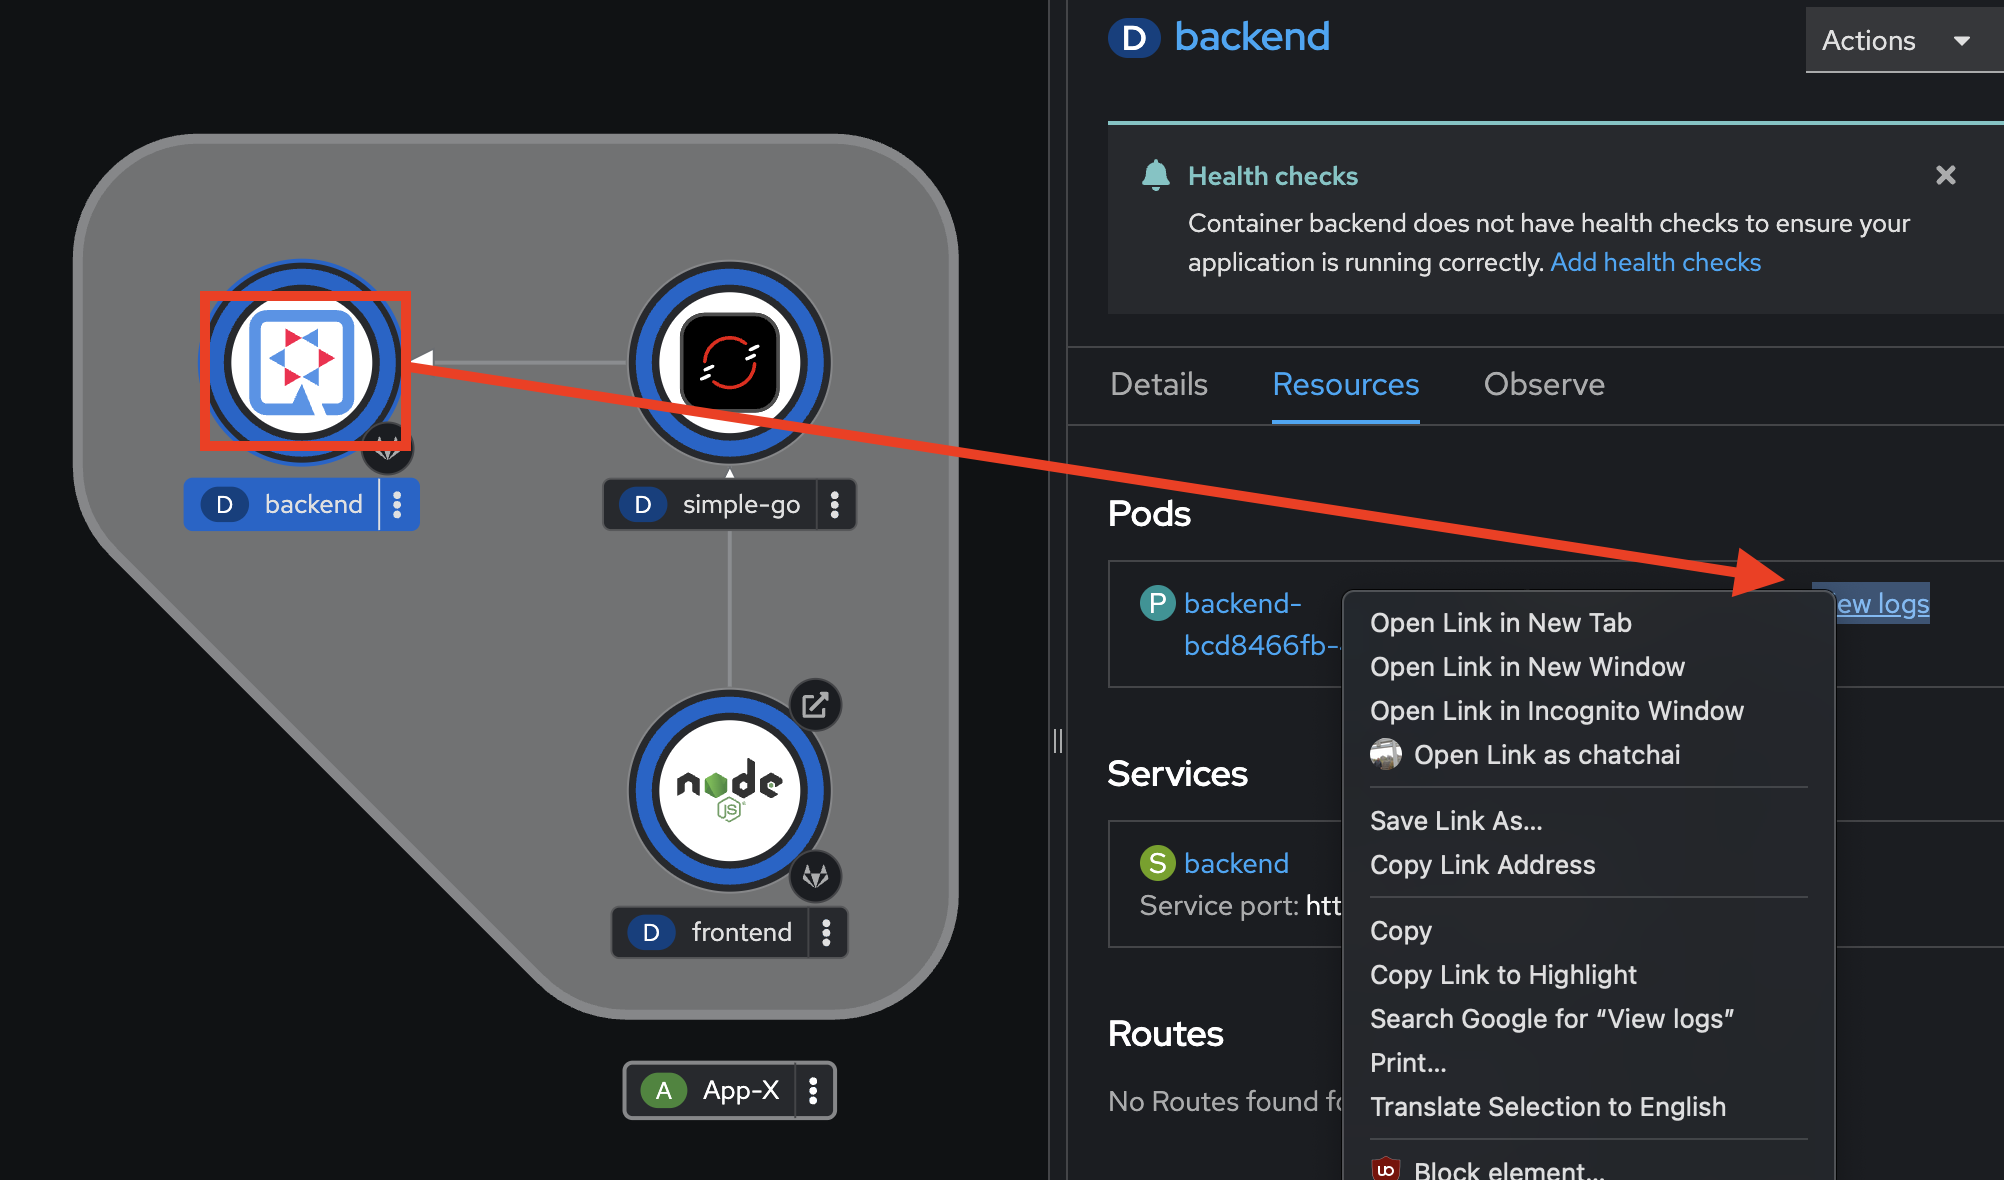
-
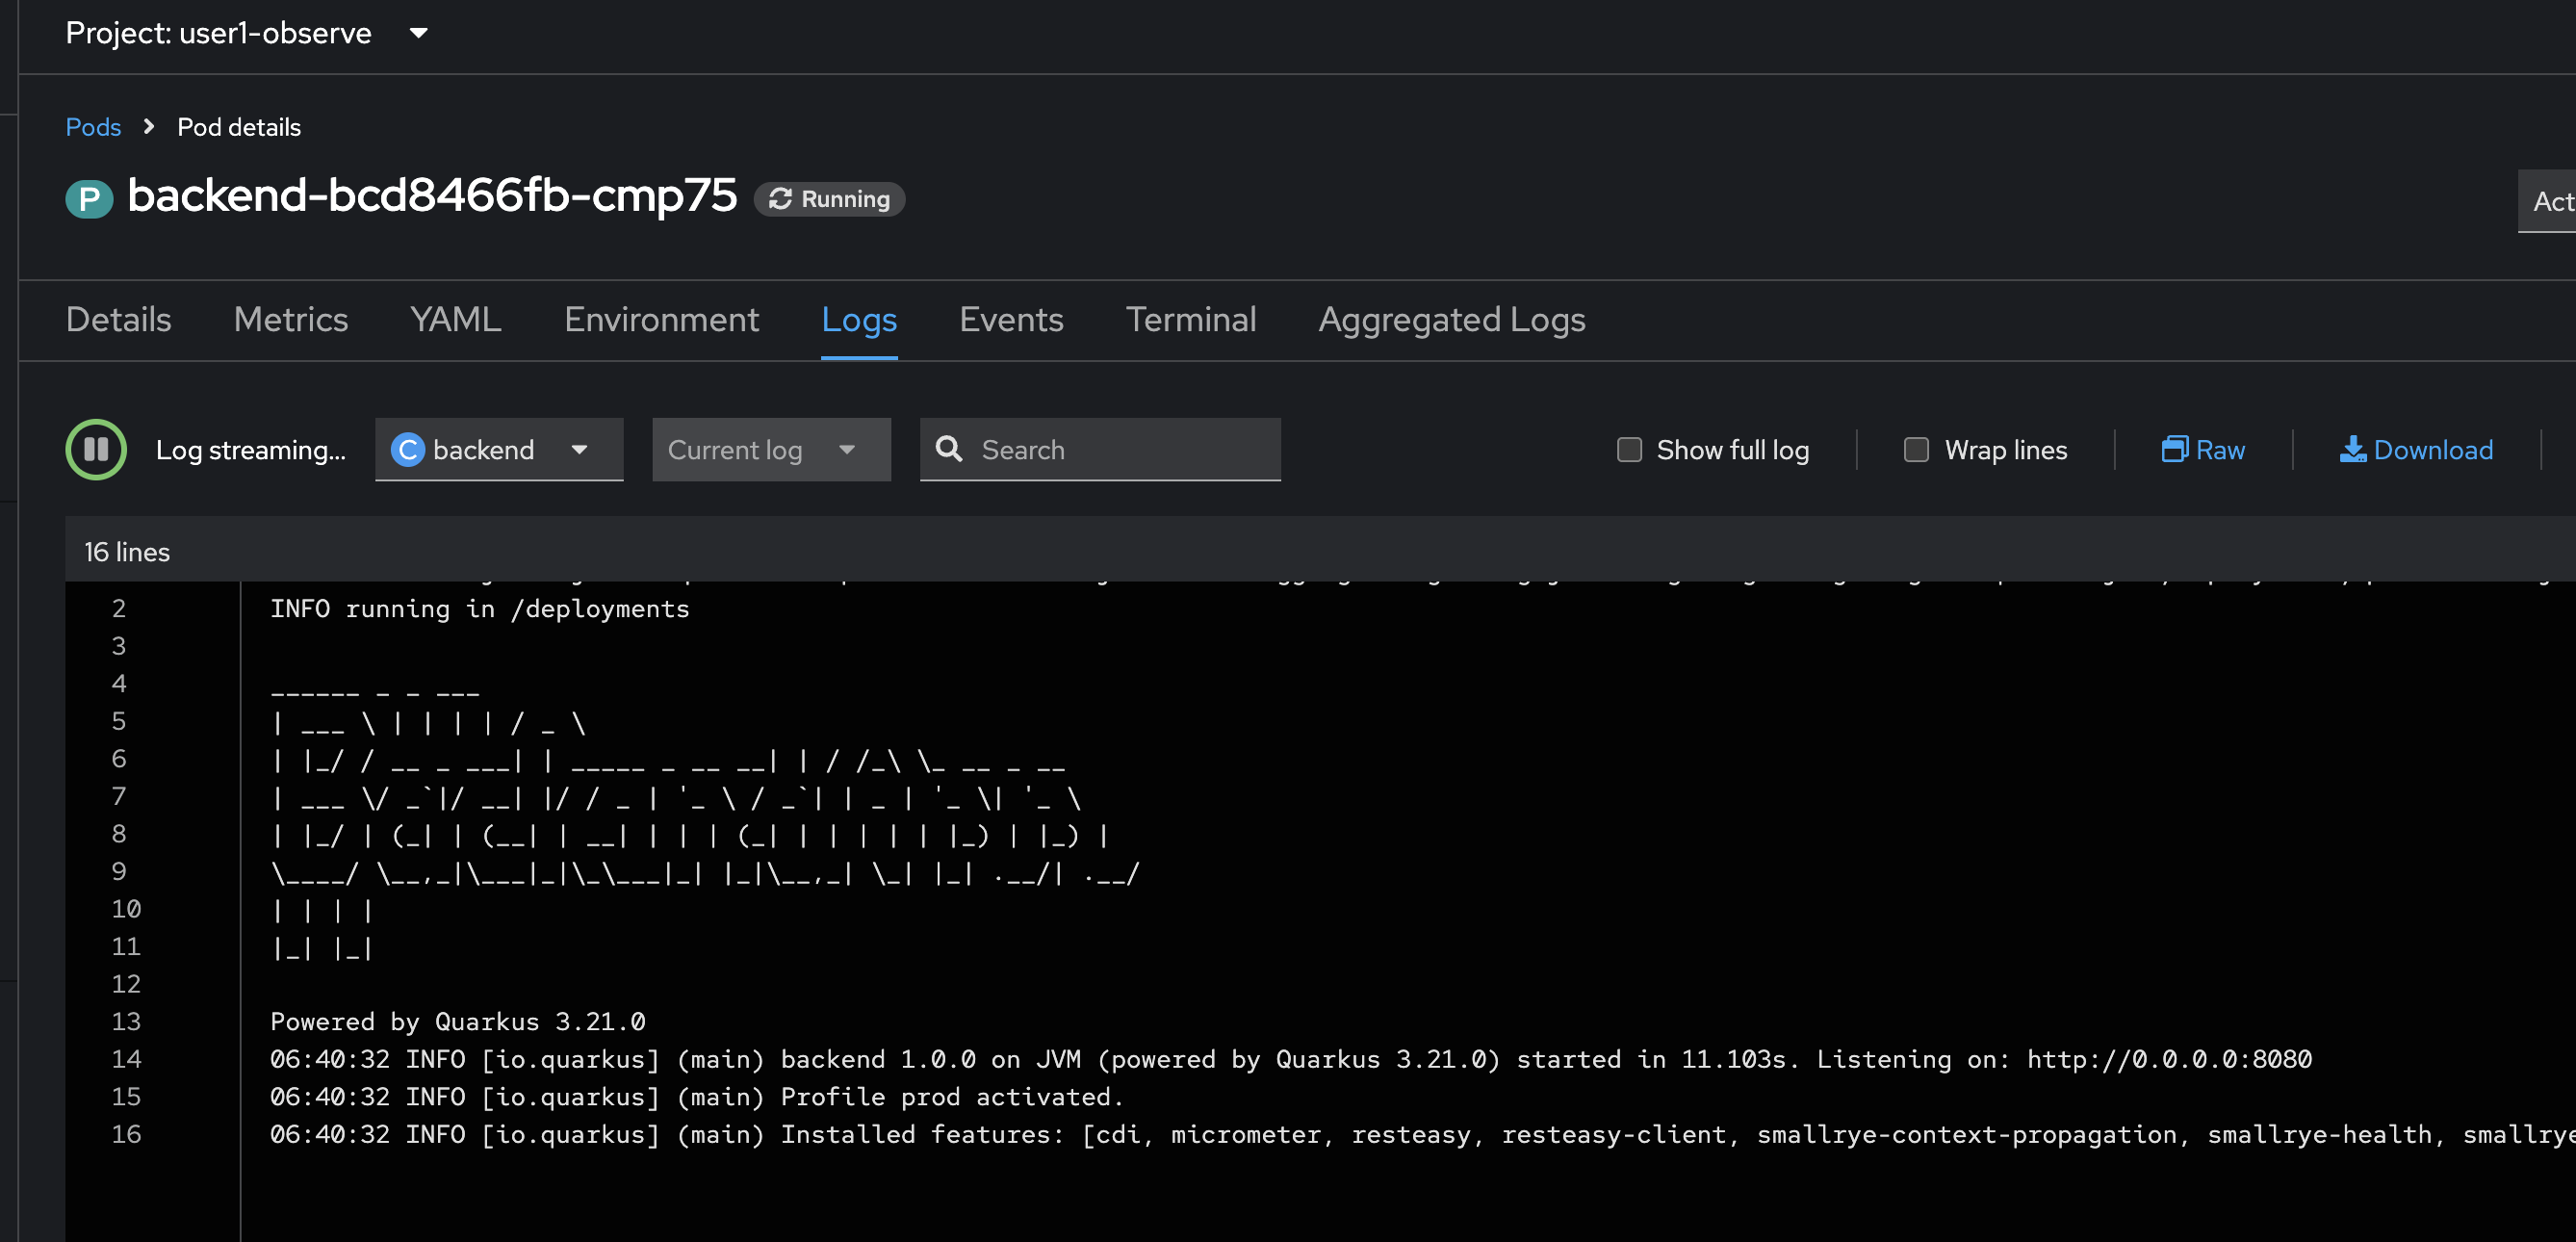
You should see the
backendapplication logs in the Logs tab in Pods Details page.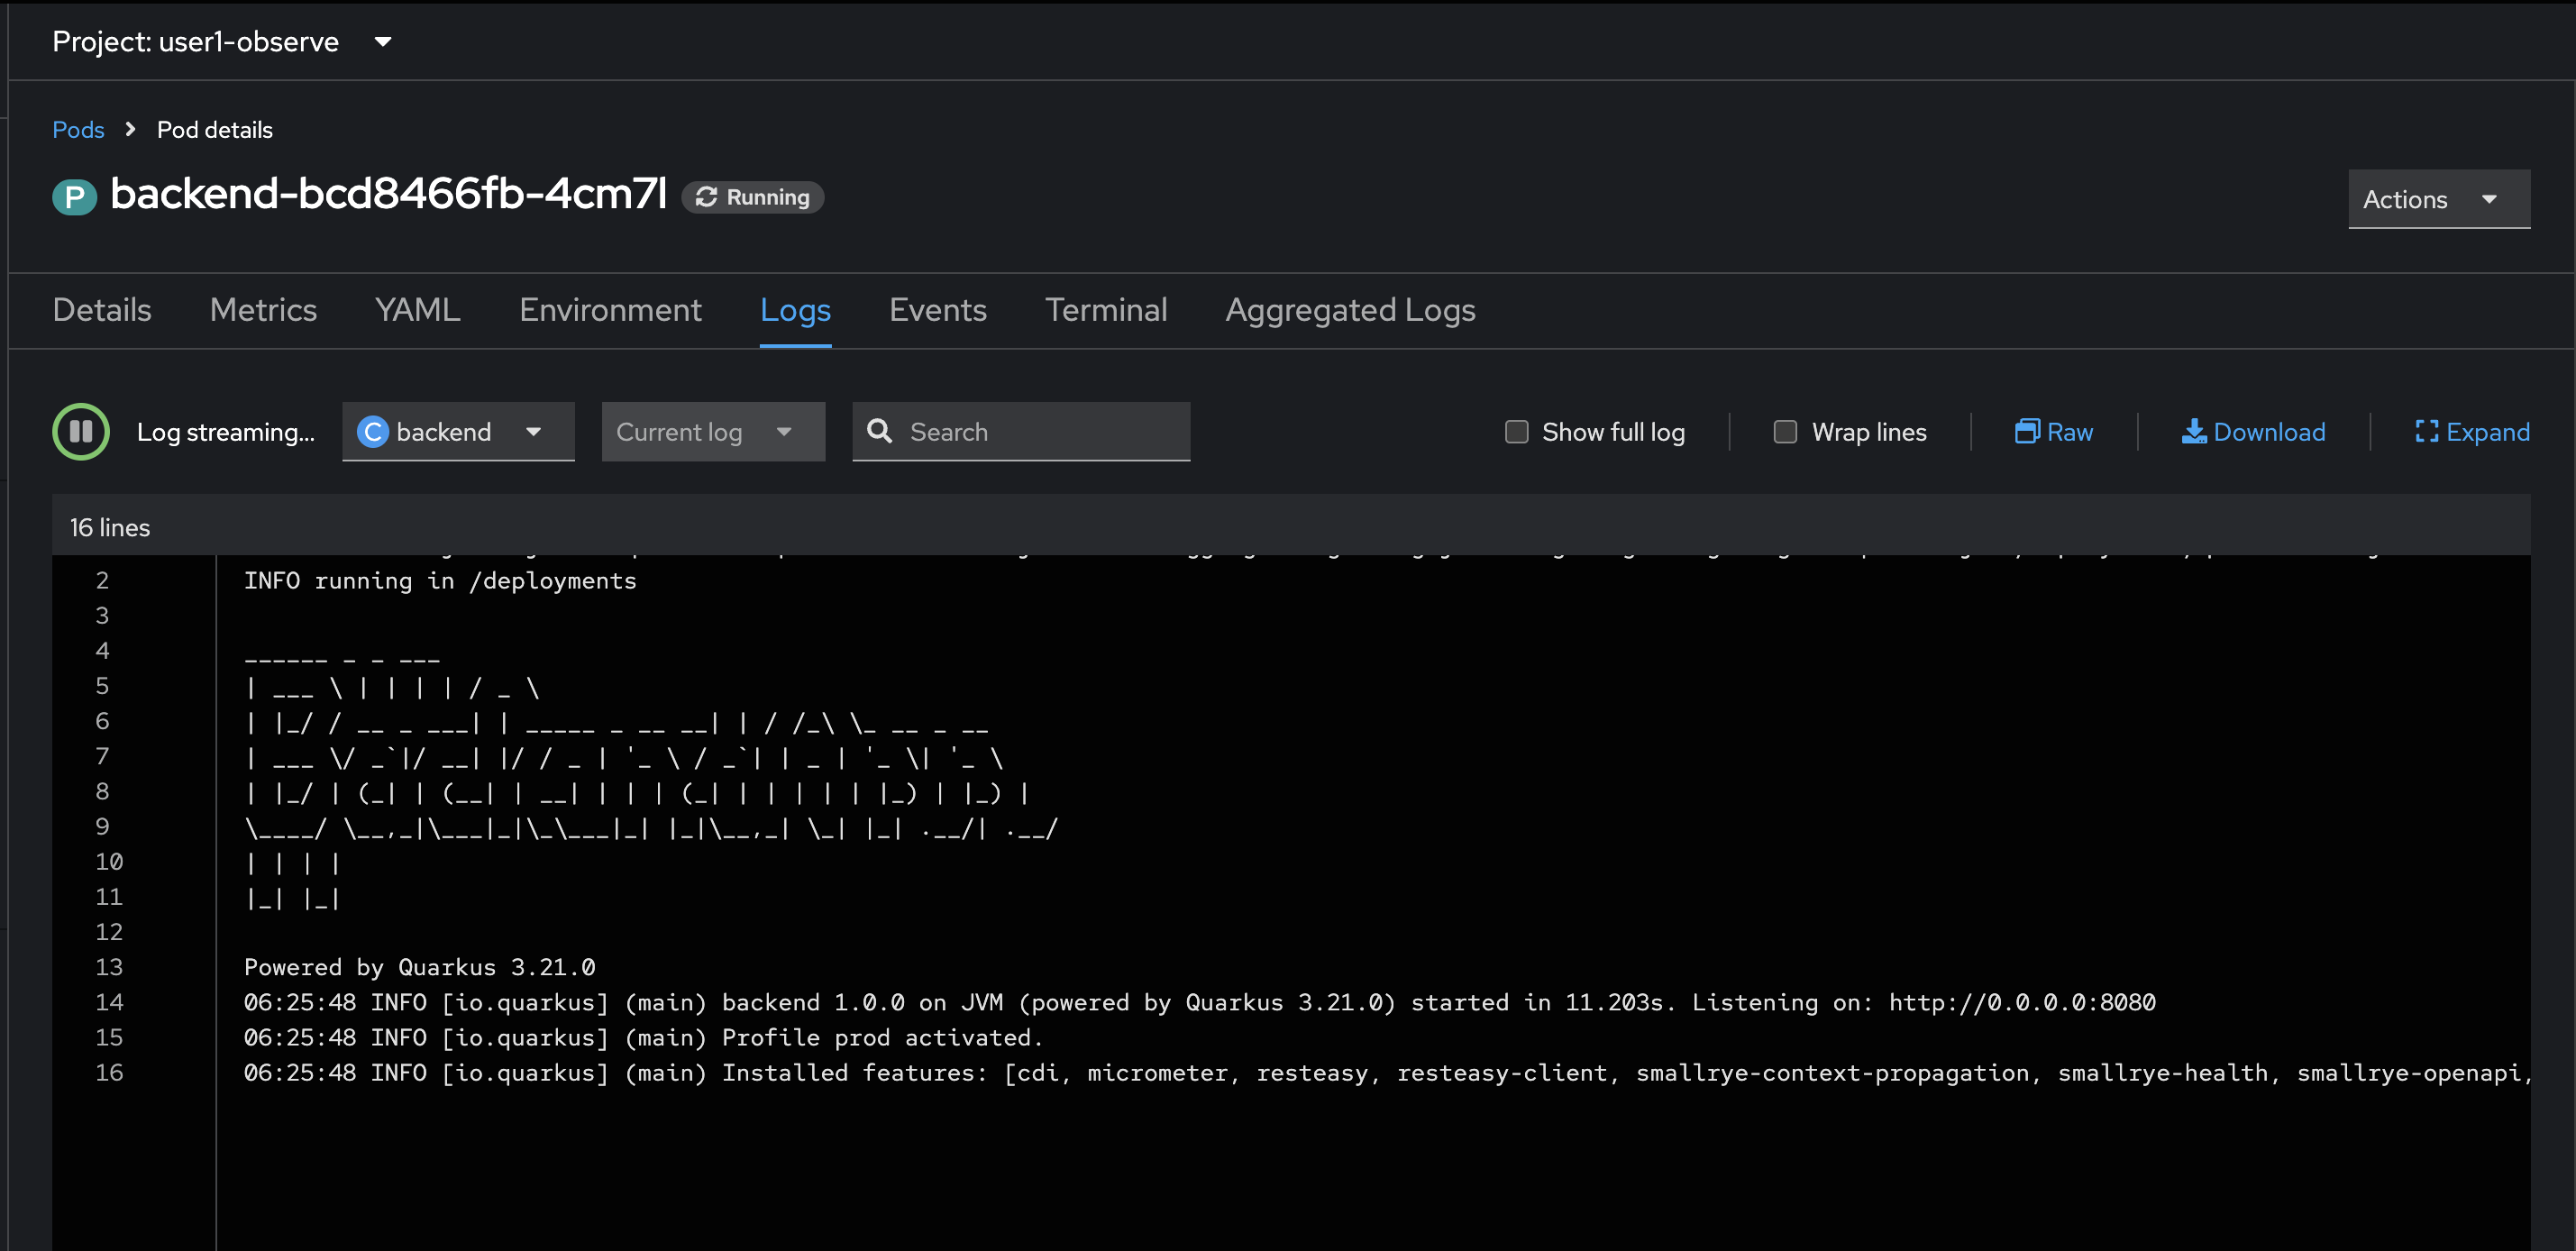
-
Go back to the web browser tab that opened with the topology view. Select the
simple-goDeployment, repeat the same steps above to view application logs.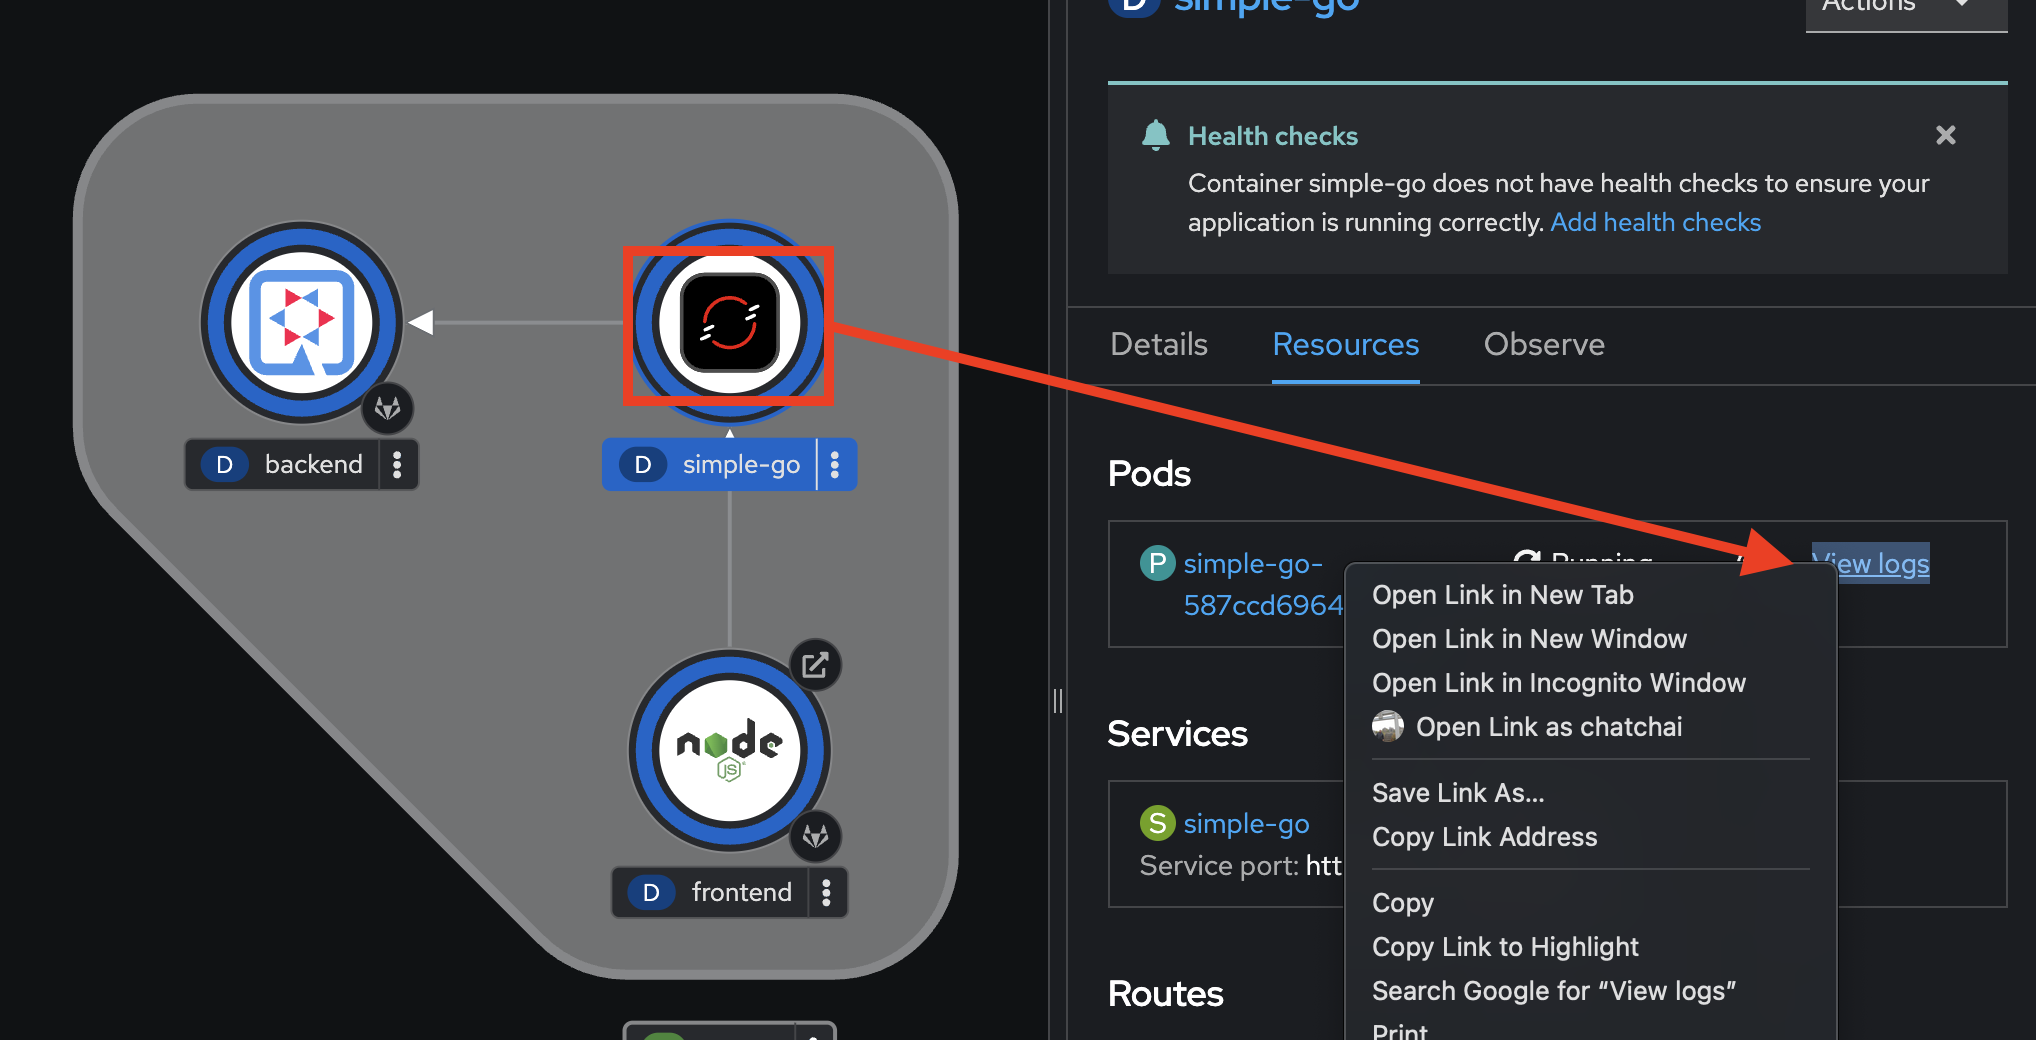
-
You should see the
simple-goapplication logs in the Logs tab in Pods Details page.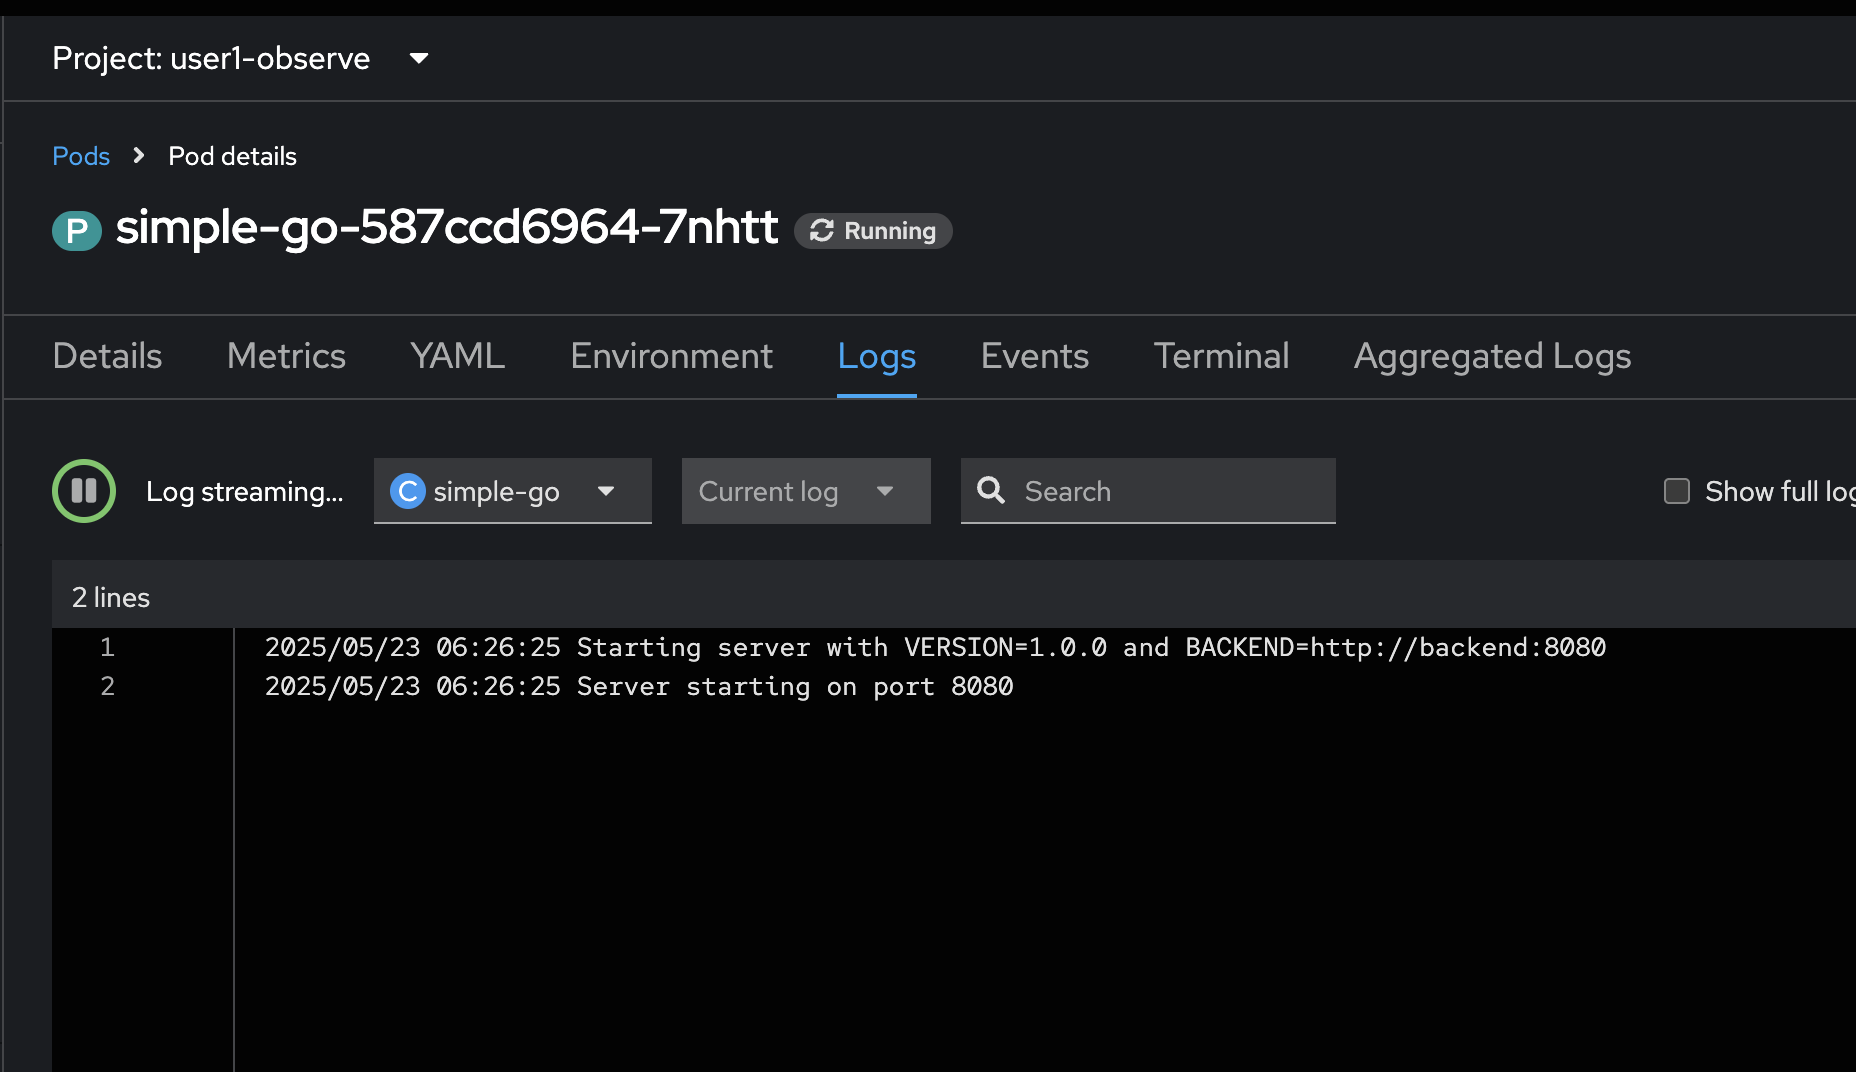
-
Go back to the web browser tab that opened with the topology view. Select the
frontendDeployment, repeat the same steps to view application logs.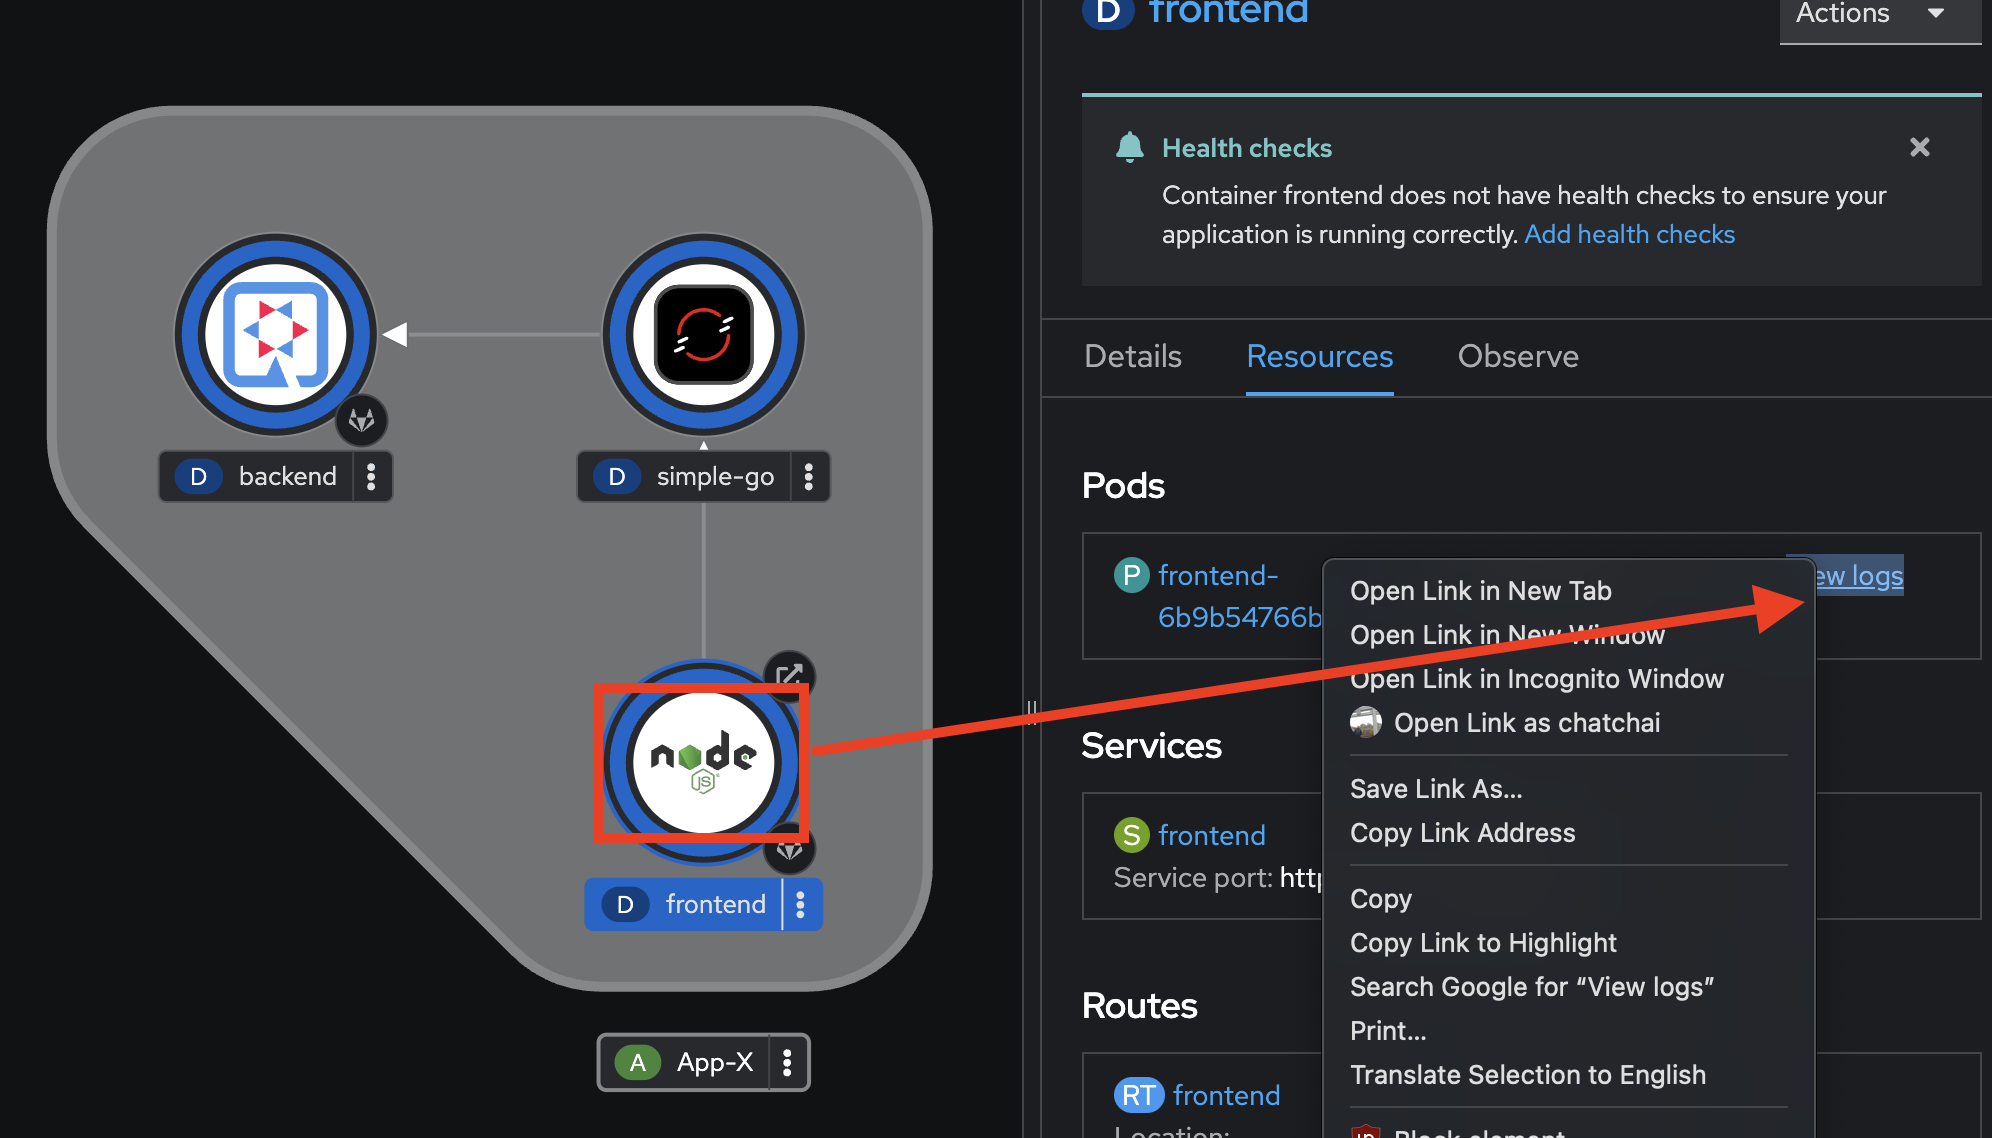
-
You should see the
frontendapplication logs in the Logs tab in Pods Details page.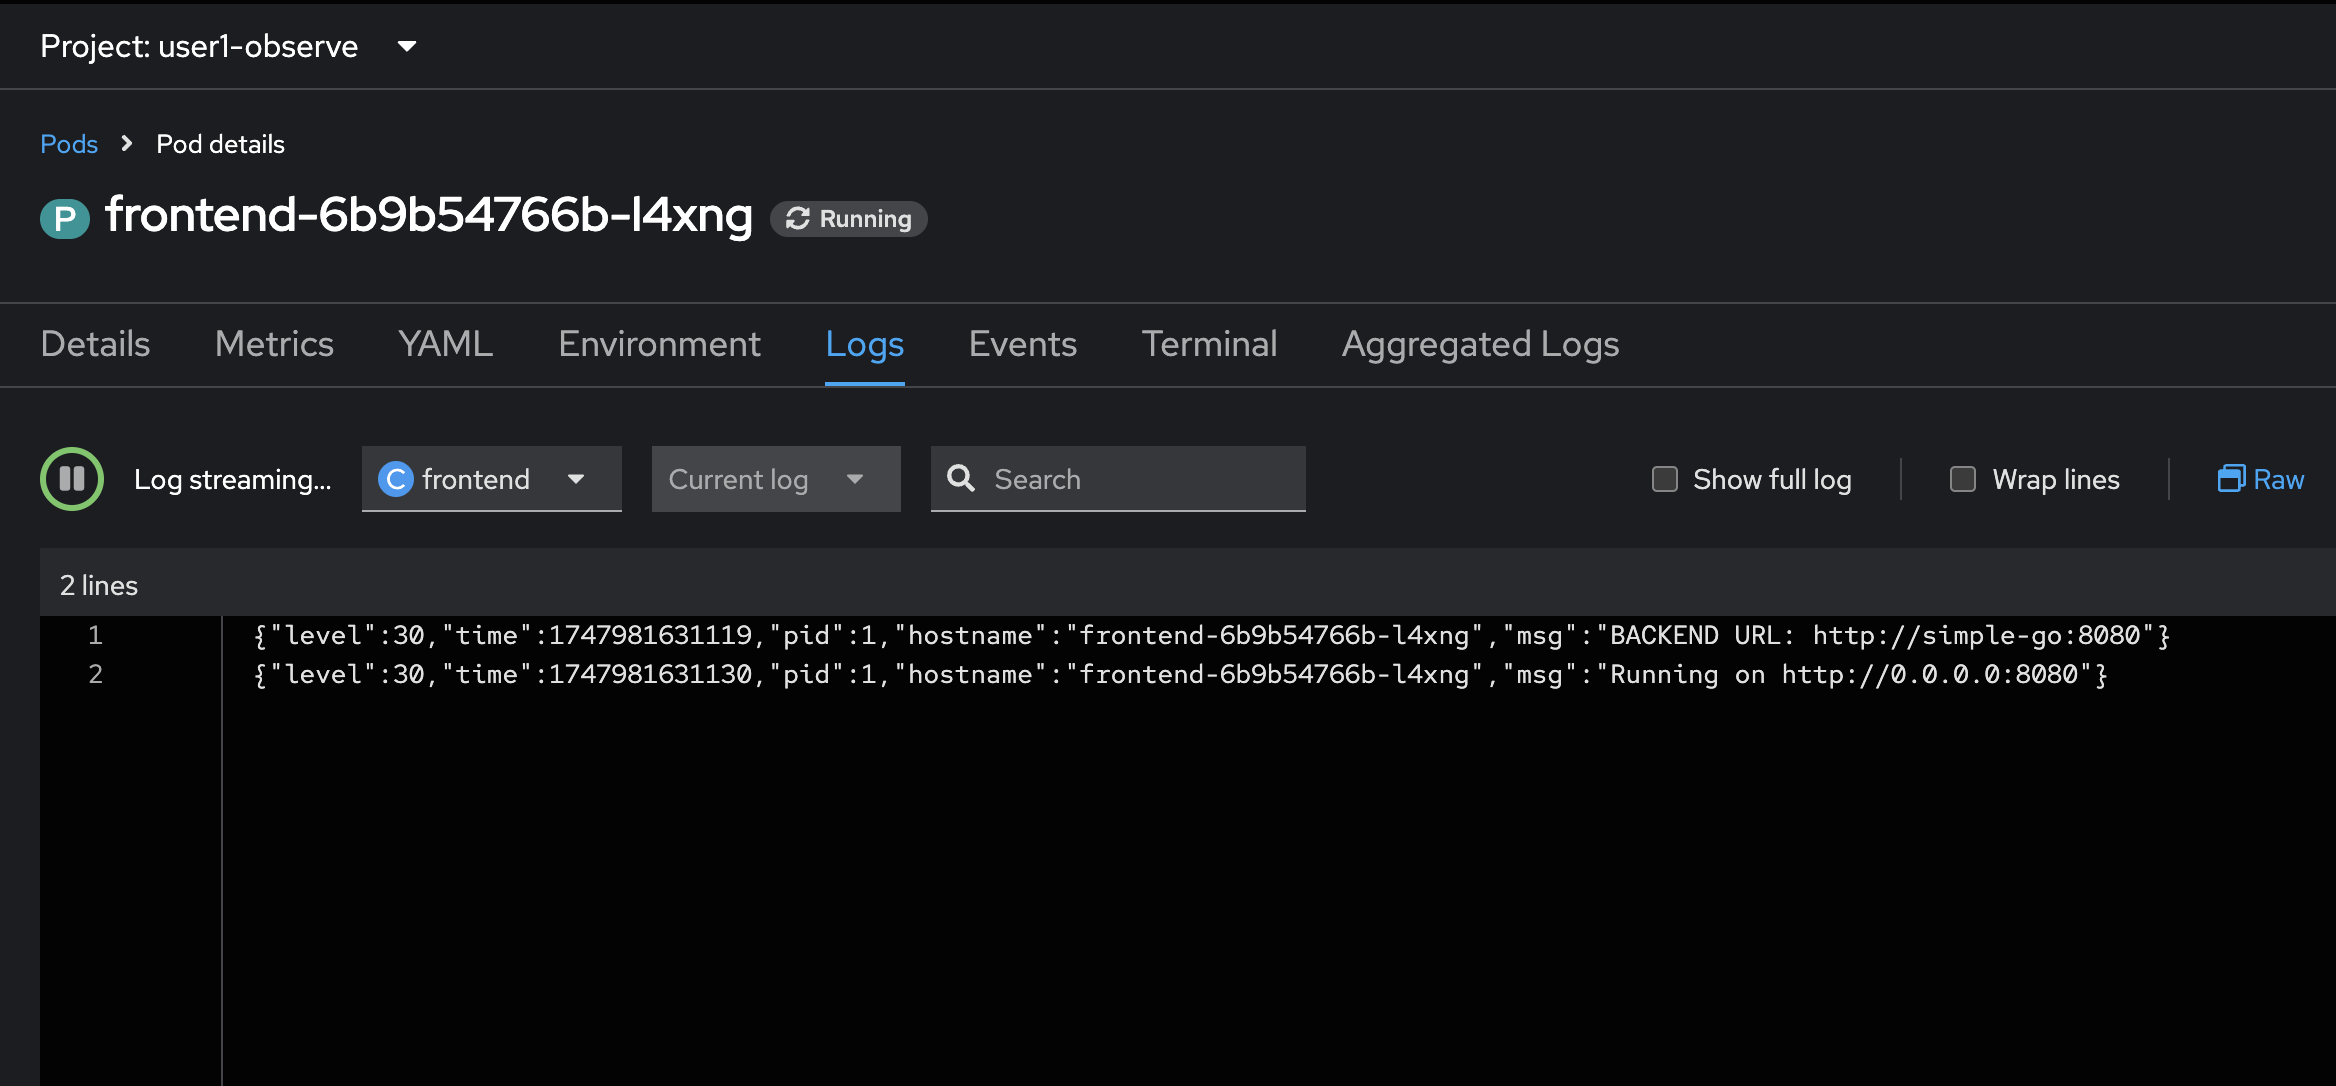
-
Go back to the web browser tab that opened with the topology view. Click on the arrow icon of the
frontendDeployment to open application URL.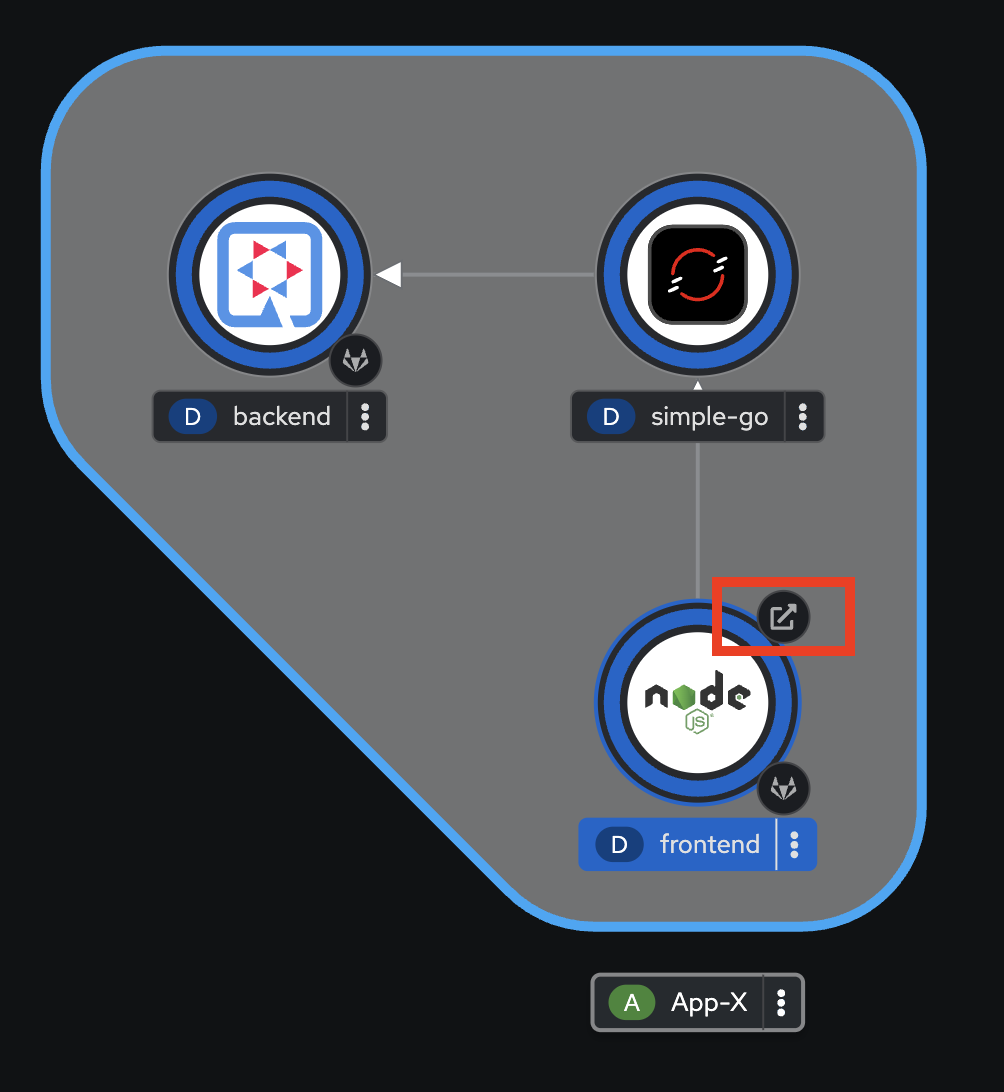
-
You shold see the response from
frontendapplication, try to refresh the web browser 2-3 times.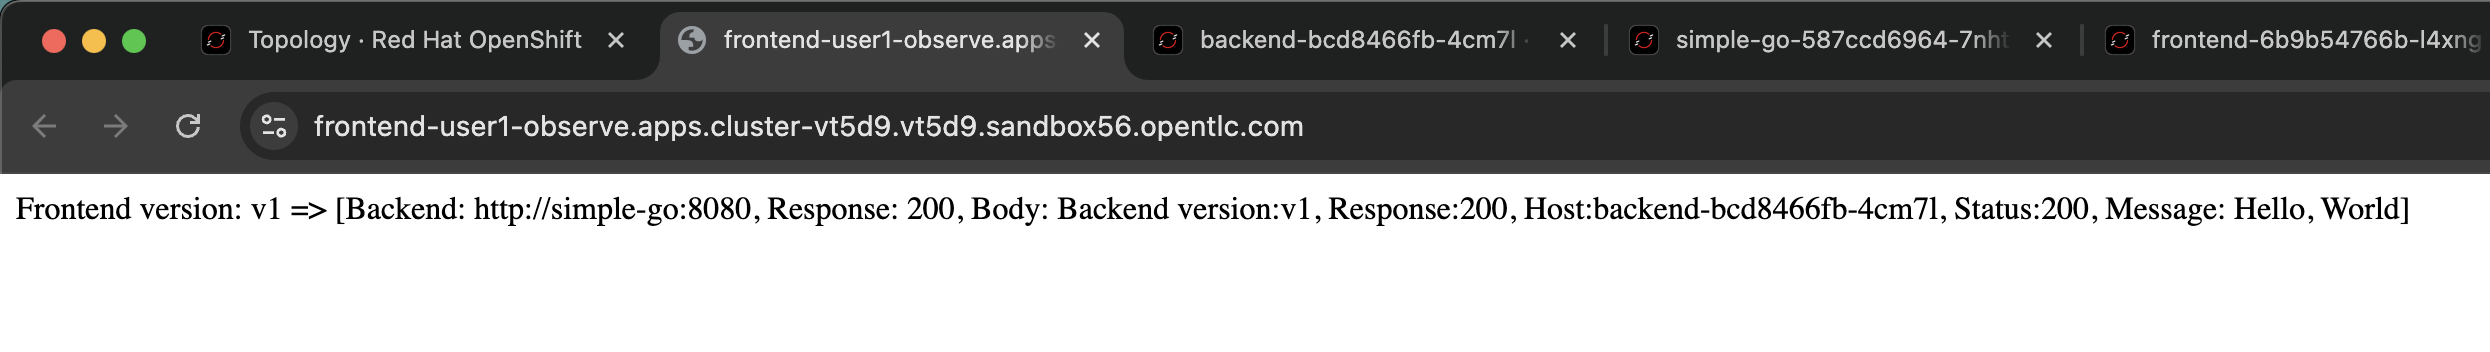
-
Review logs of
frontendapplication in the web browser tab we opened earlier. You should see new log messages from the application.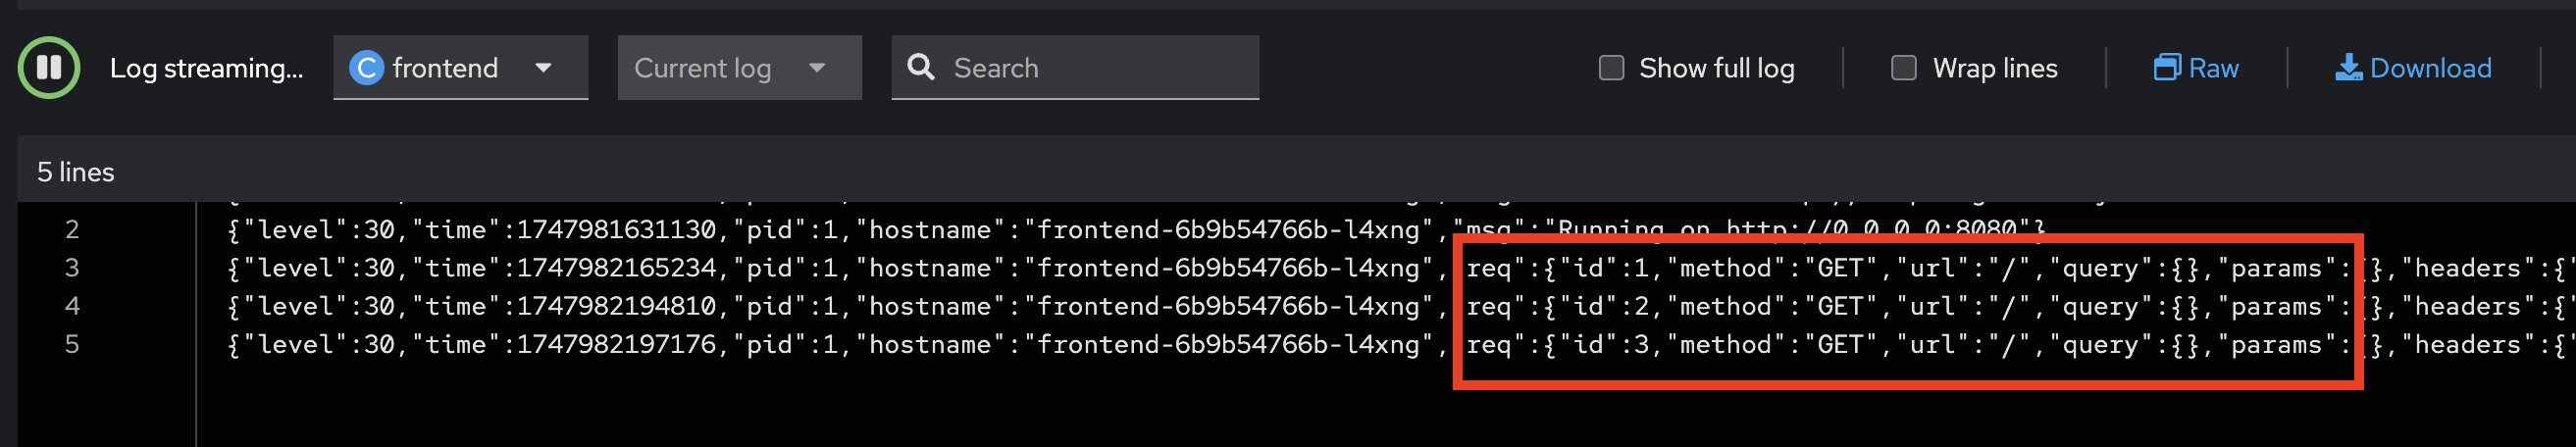
if the logs don’t show up, please check whether the
Log steam paused. If so, just click the play button.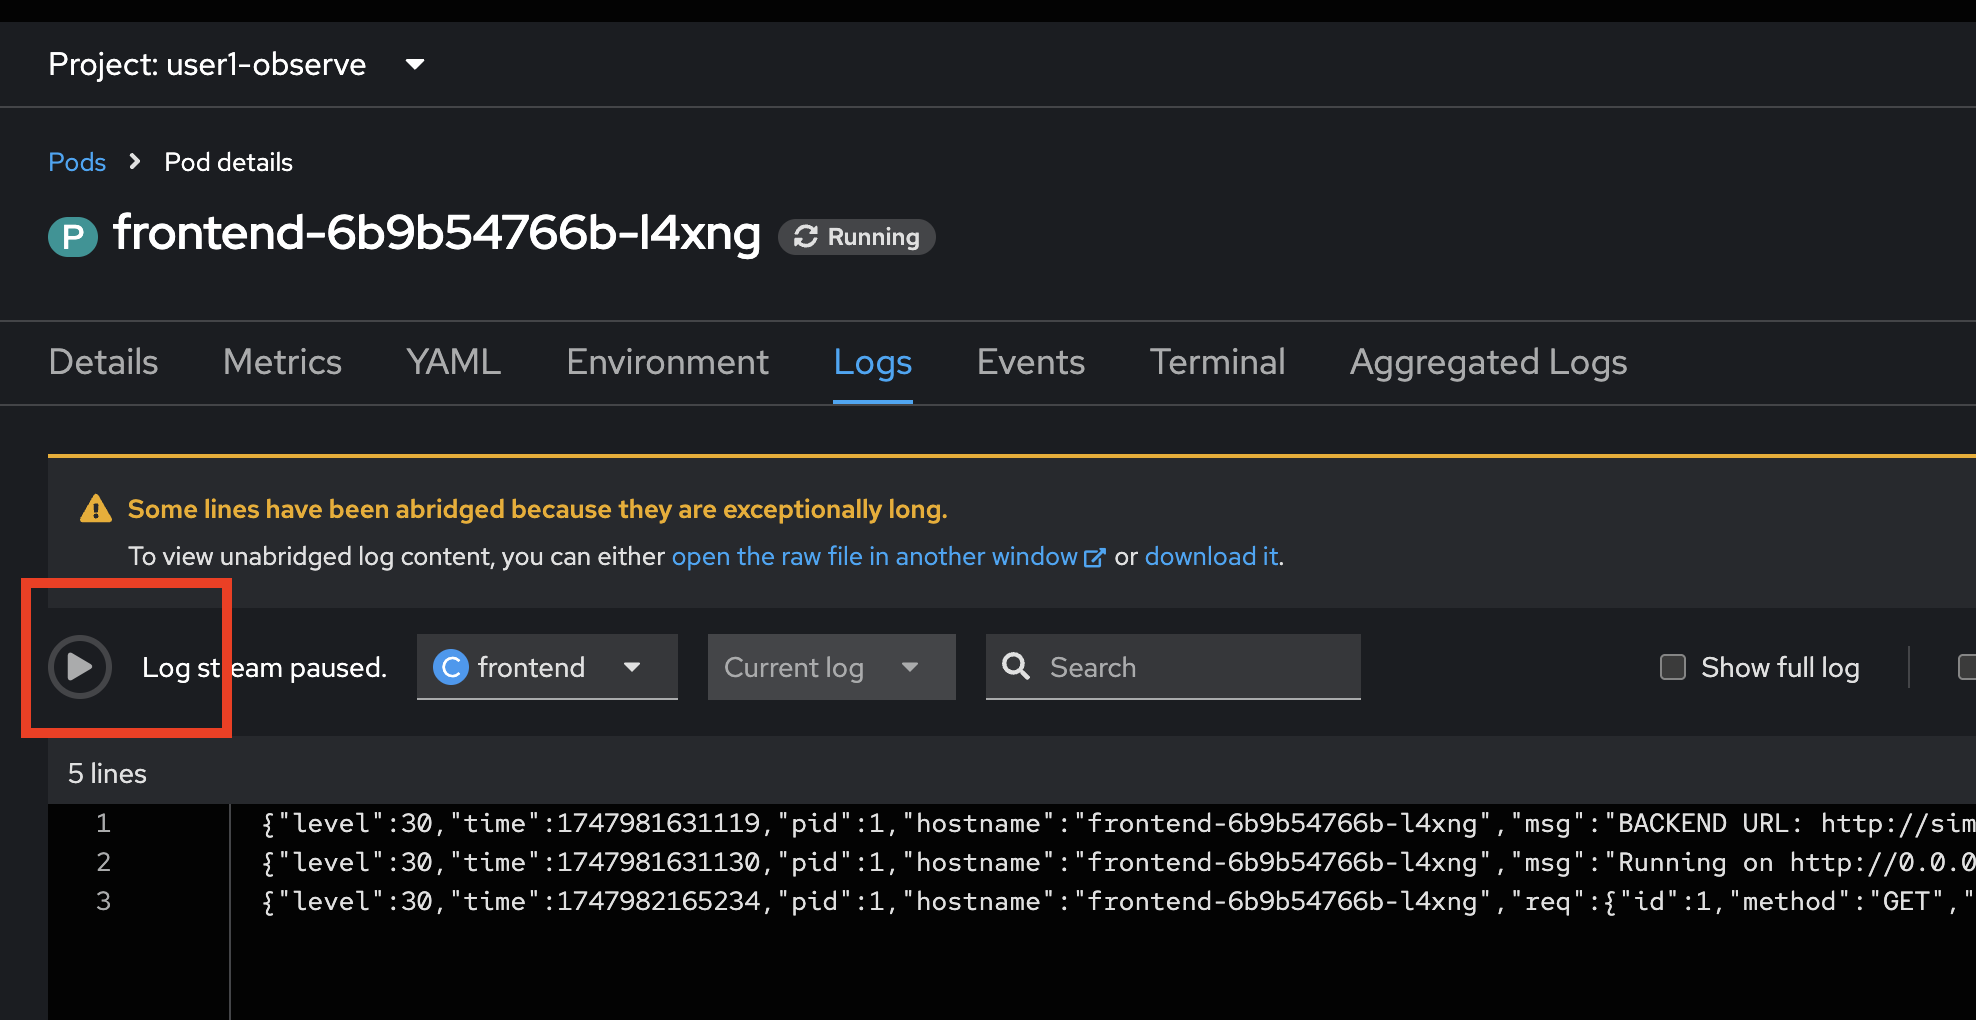
-
Review logs of
simple-goapplication in the web browser tab we opened earlier. You should see new log messages from the application.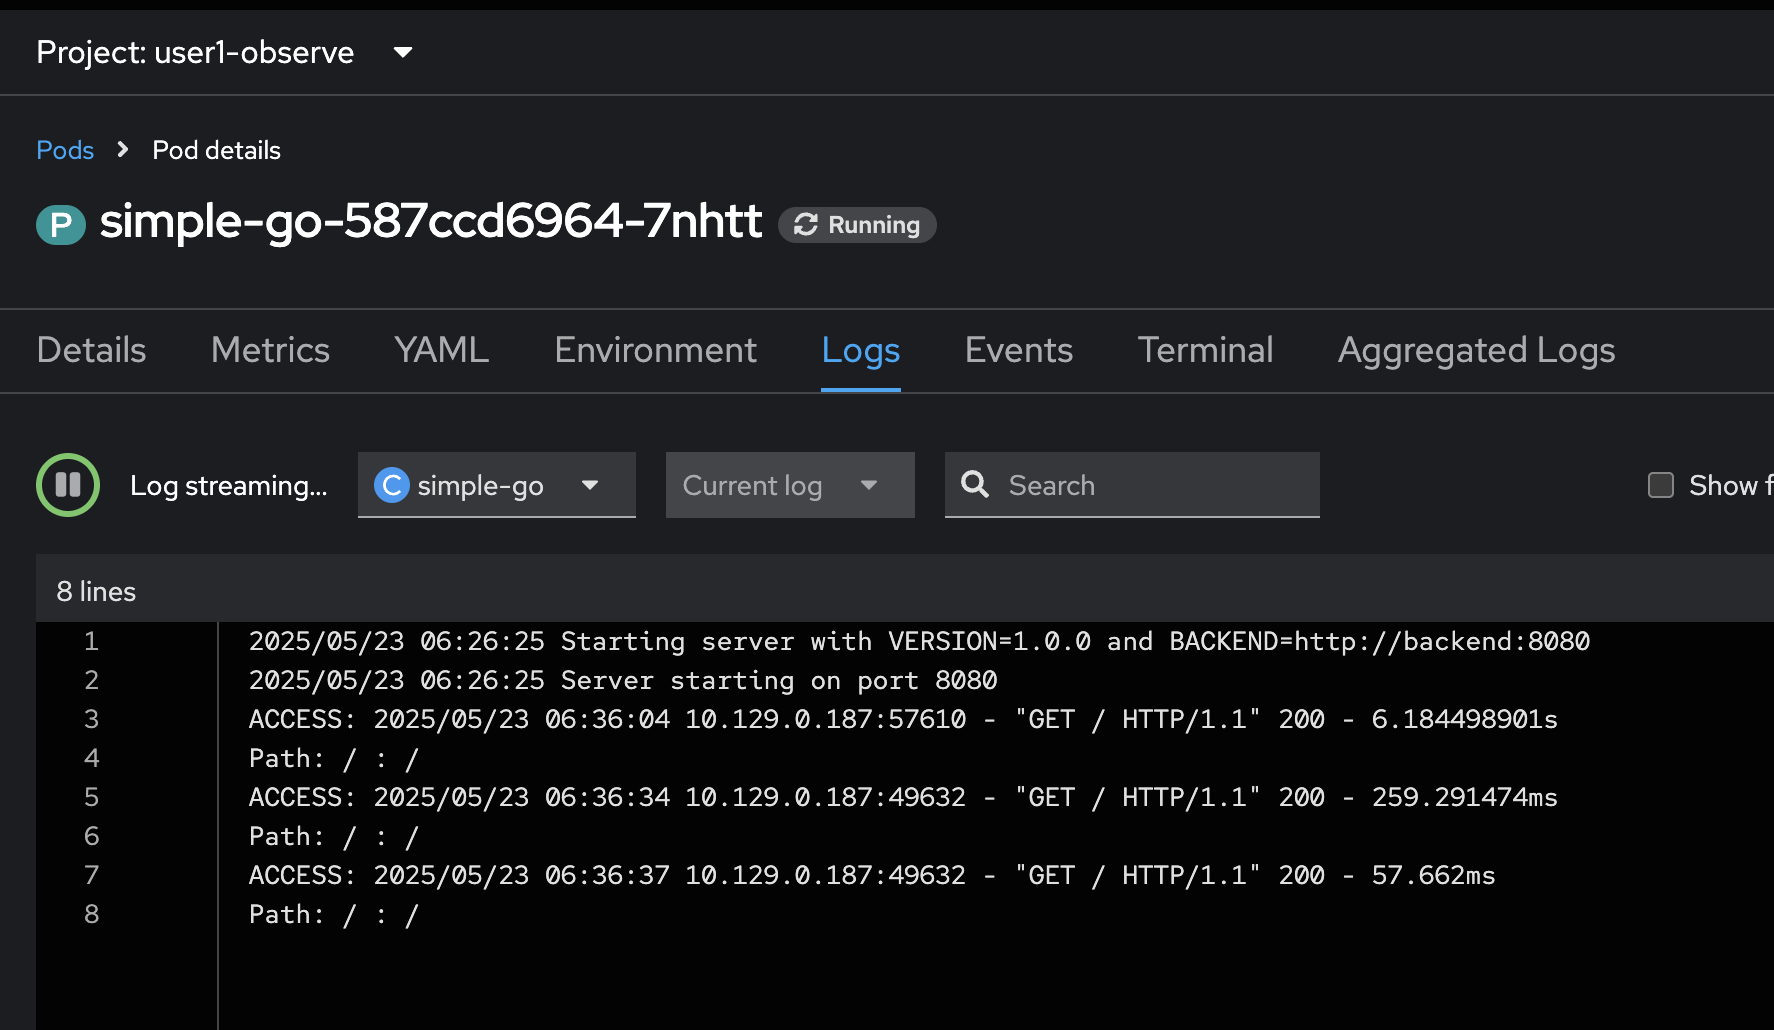
-
Review logs of
backendapplication in the web browser tab we opened earlier. You should see new log messages from the application.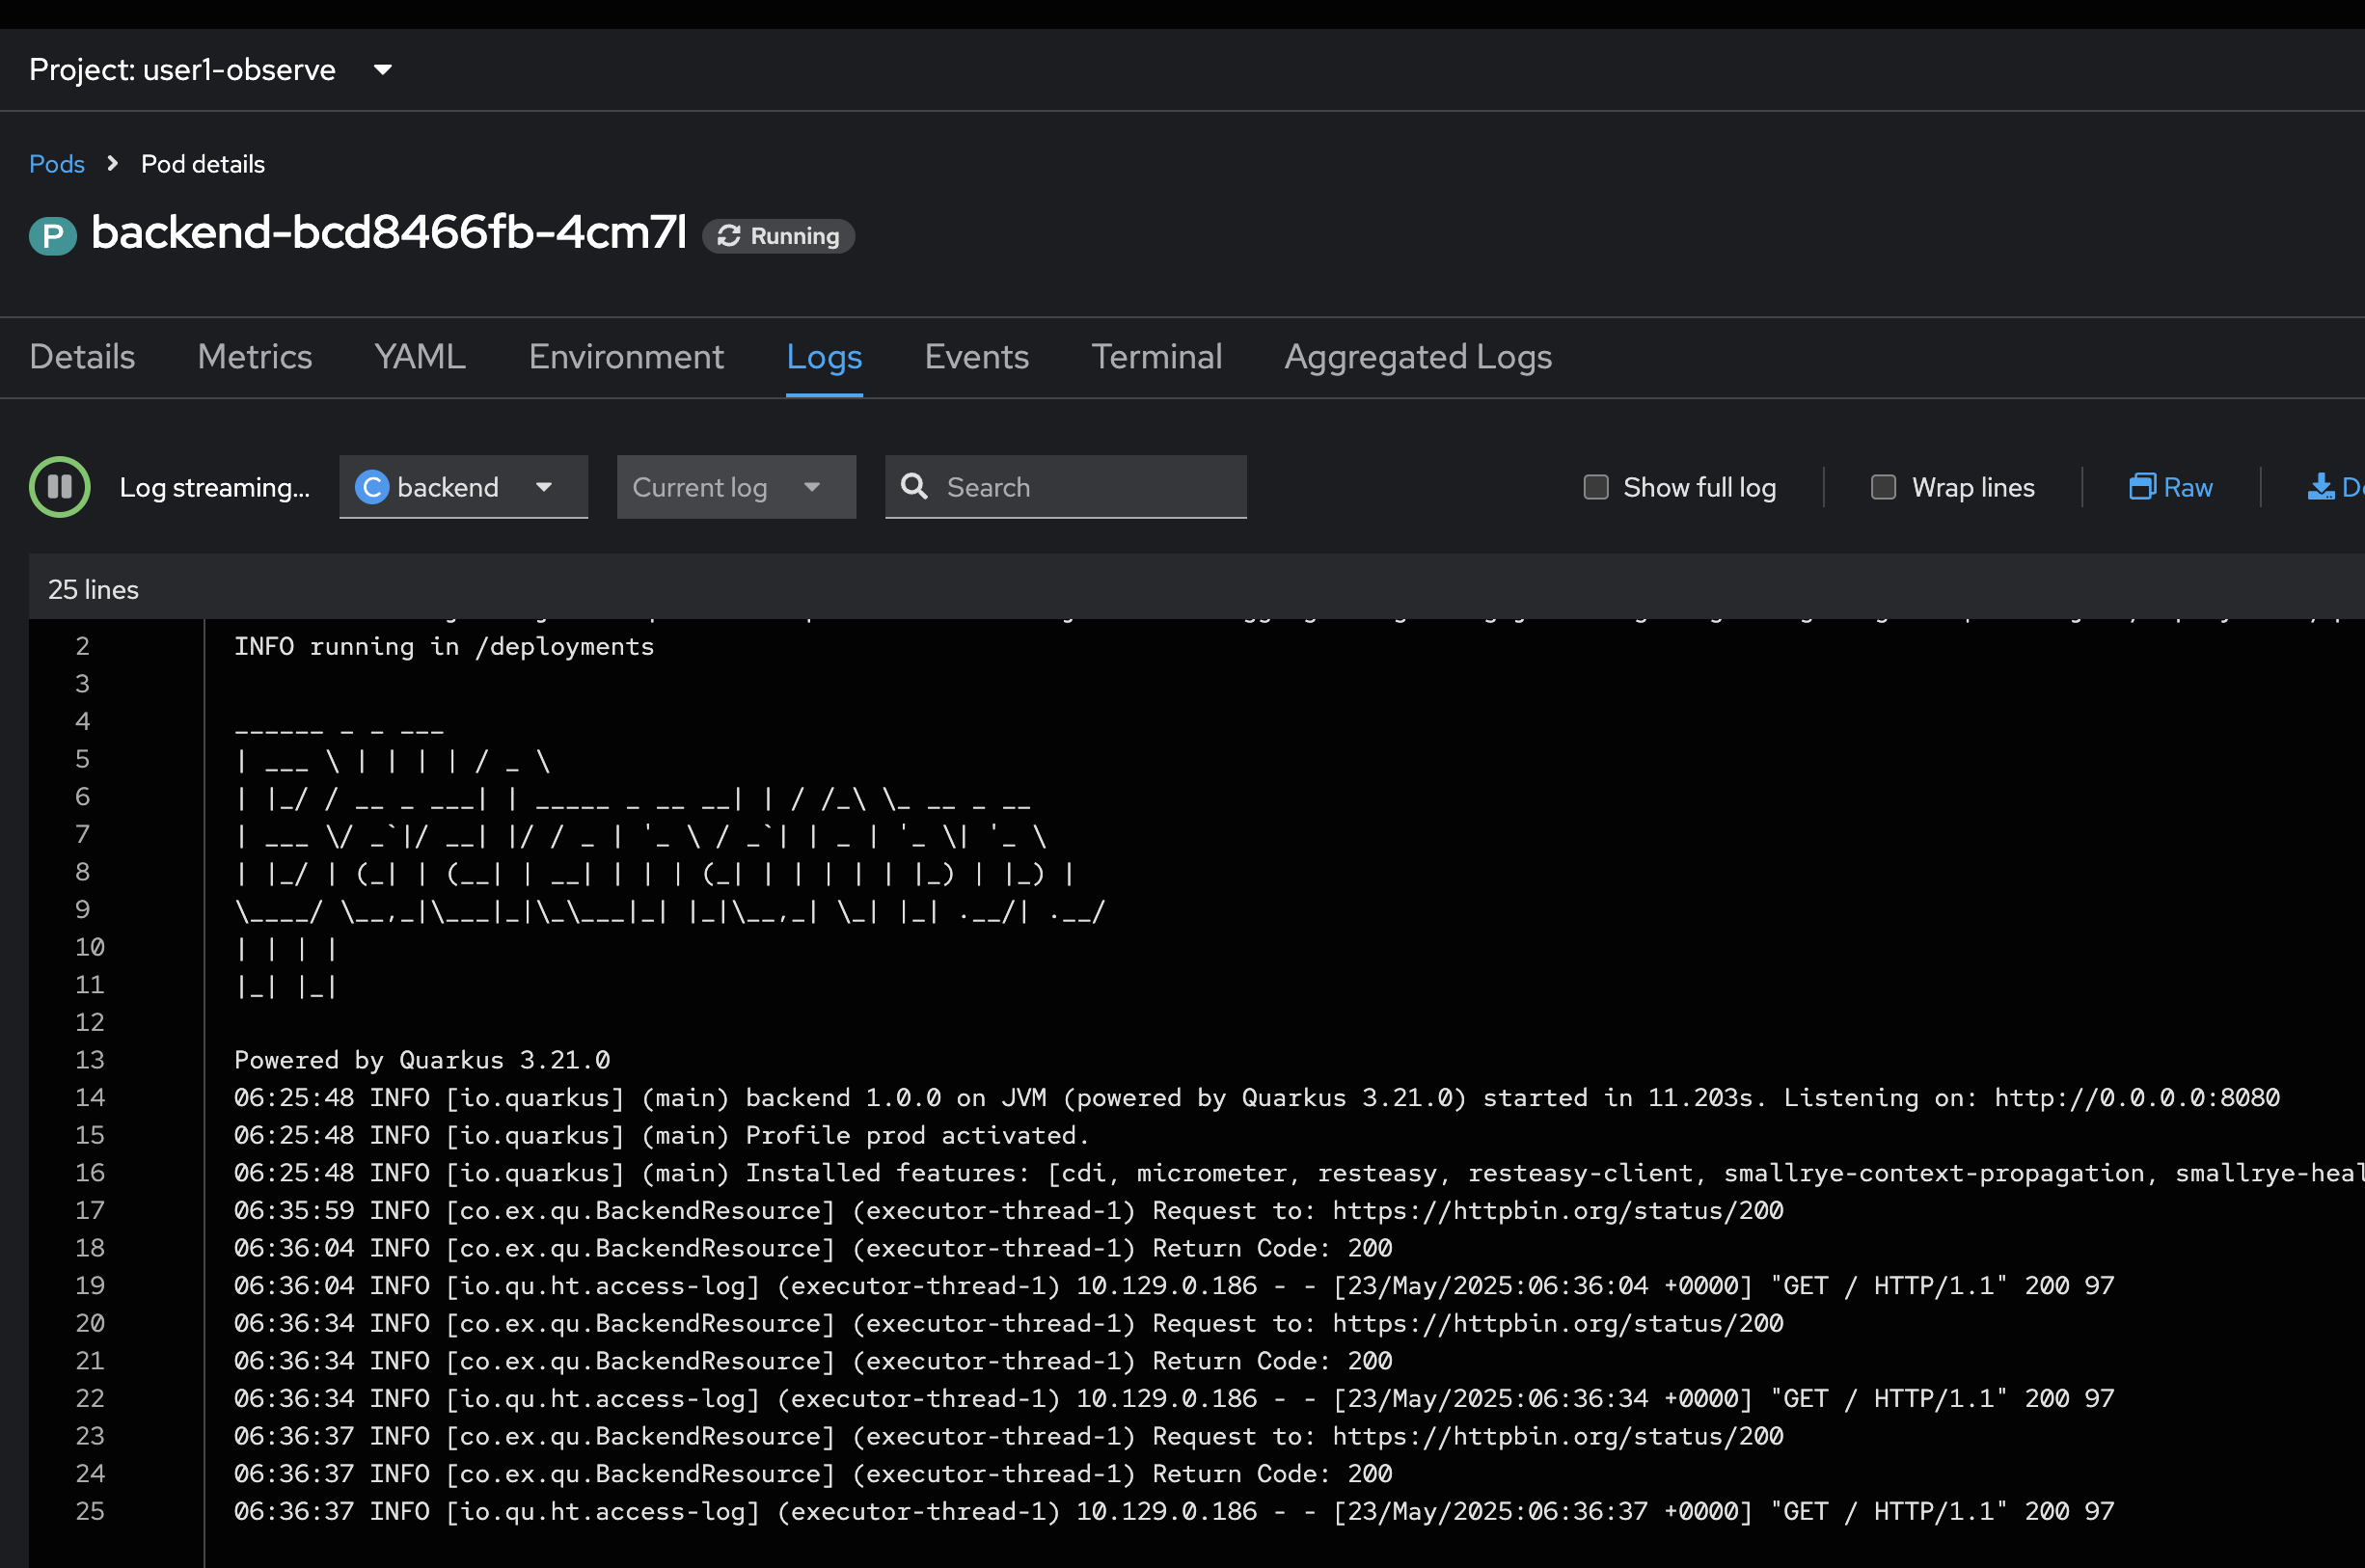
-
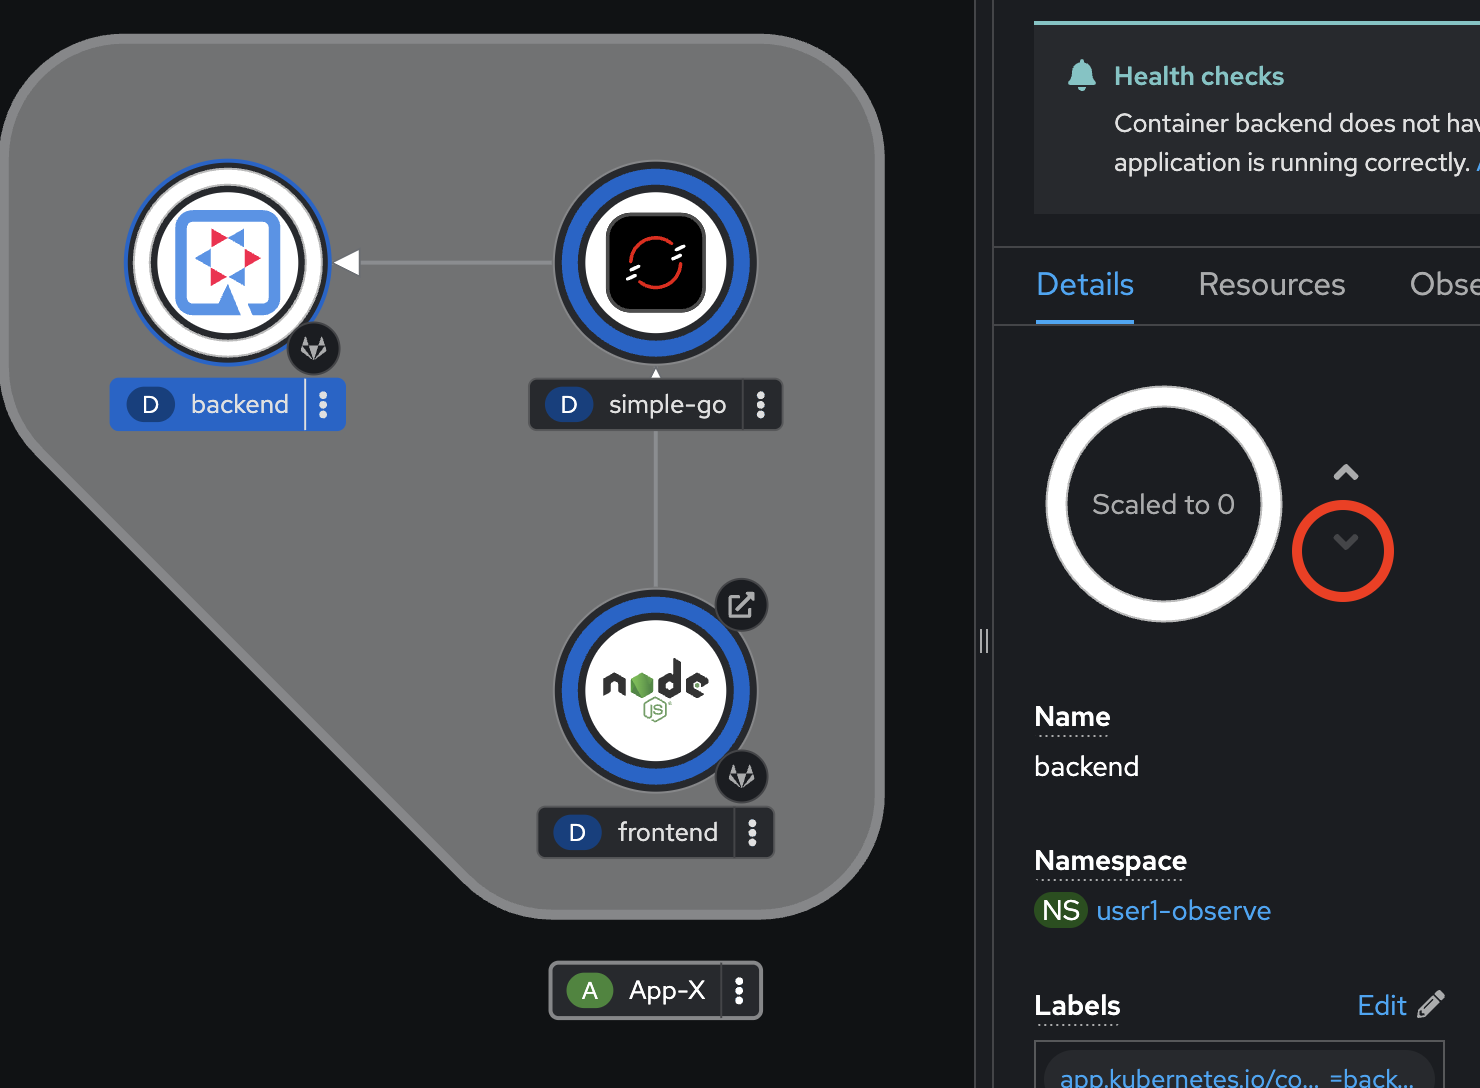
Try to restart the
backendapplication by select thebackenddeployment, go to the Details tab on the right panel. Then click v button to scale the Pod to0and wait until the Pod scaled down to0.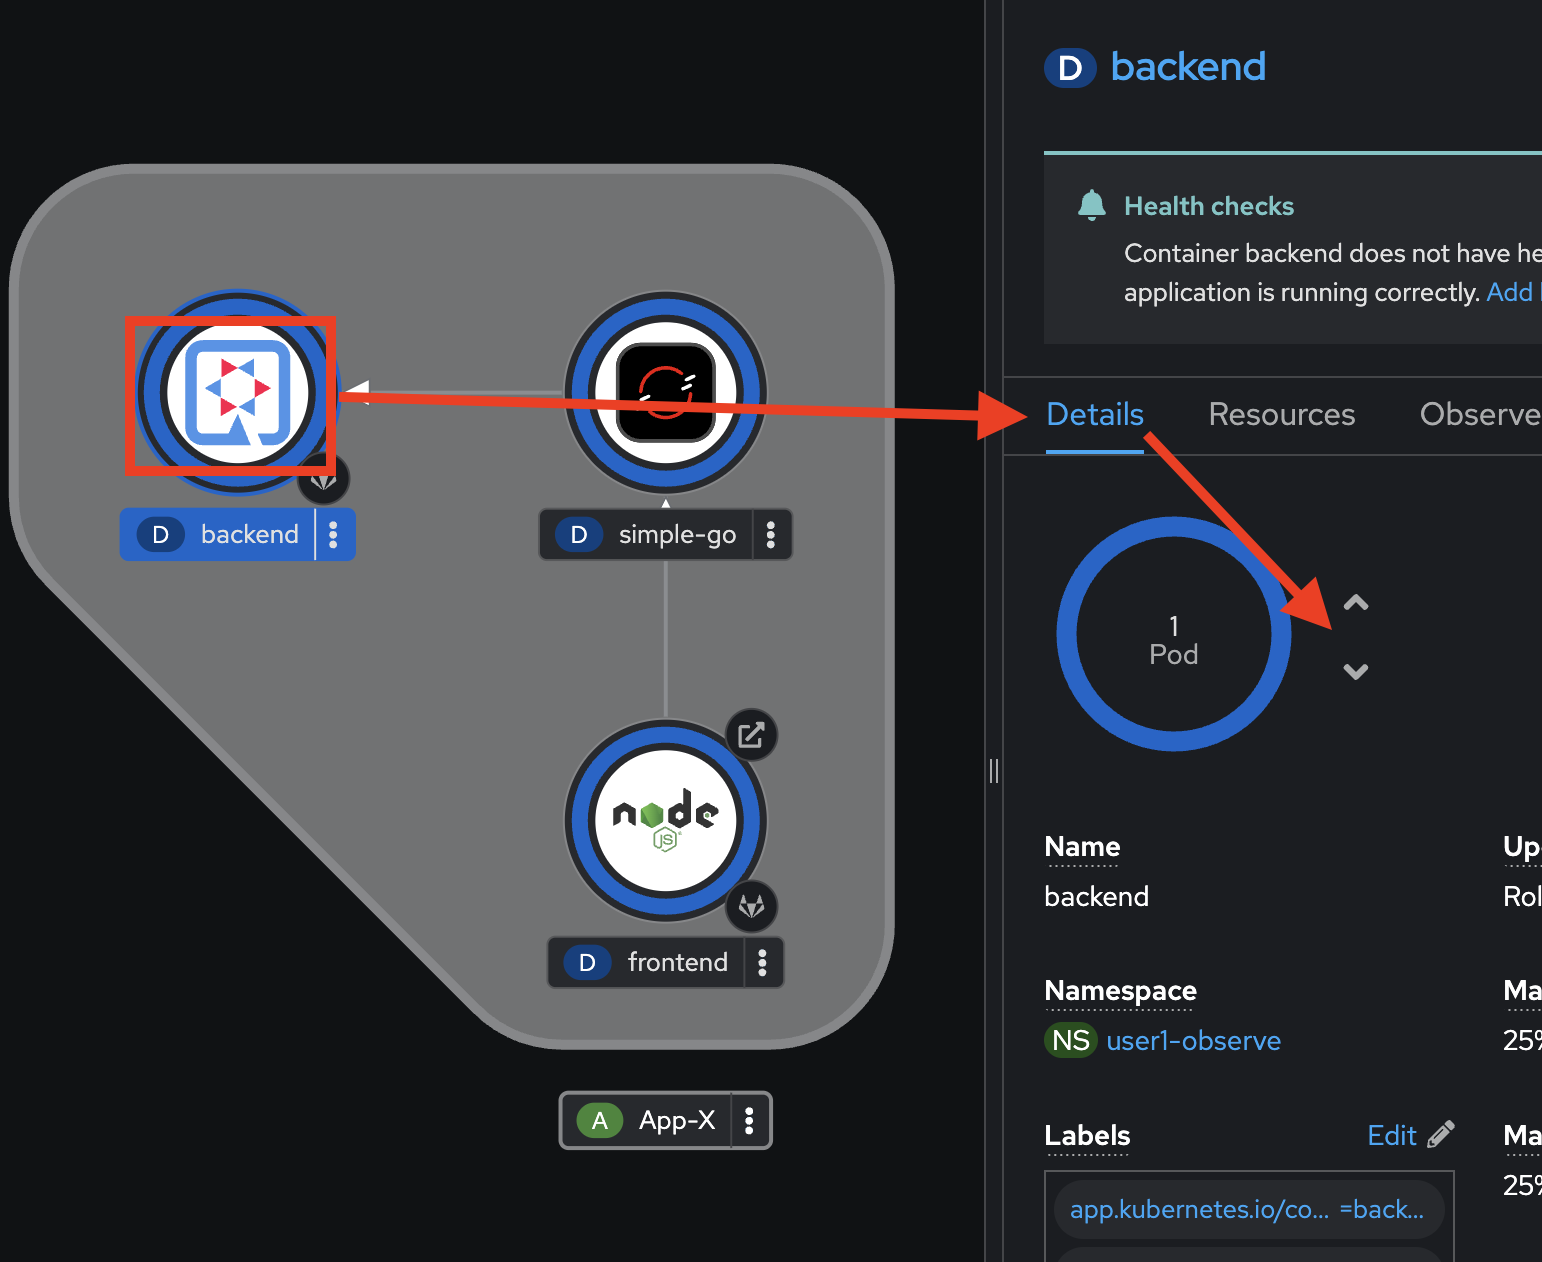
-
Click on ^ button to scale Pod up to
1again.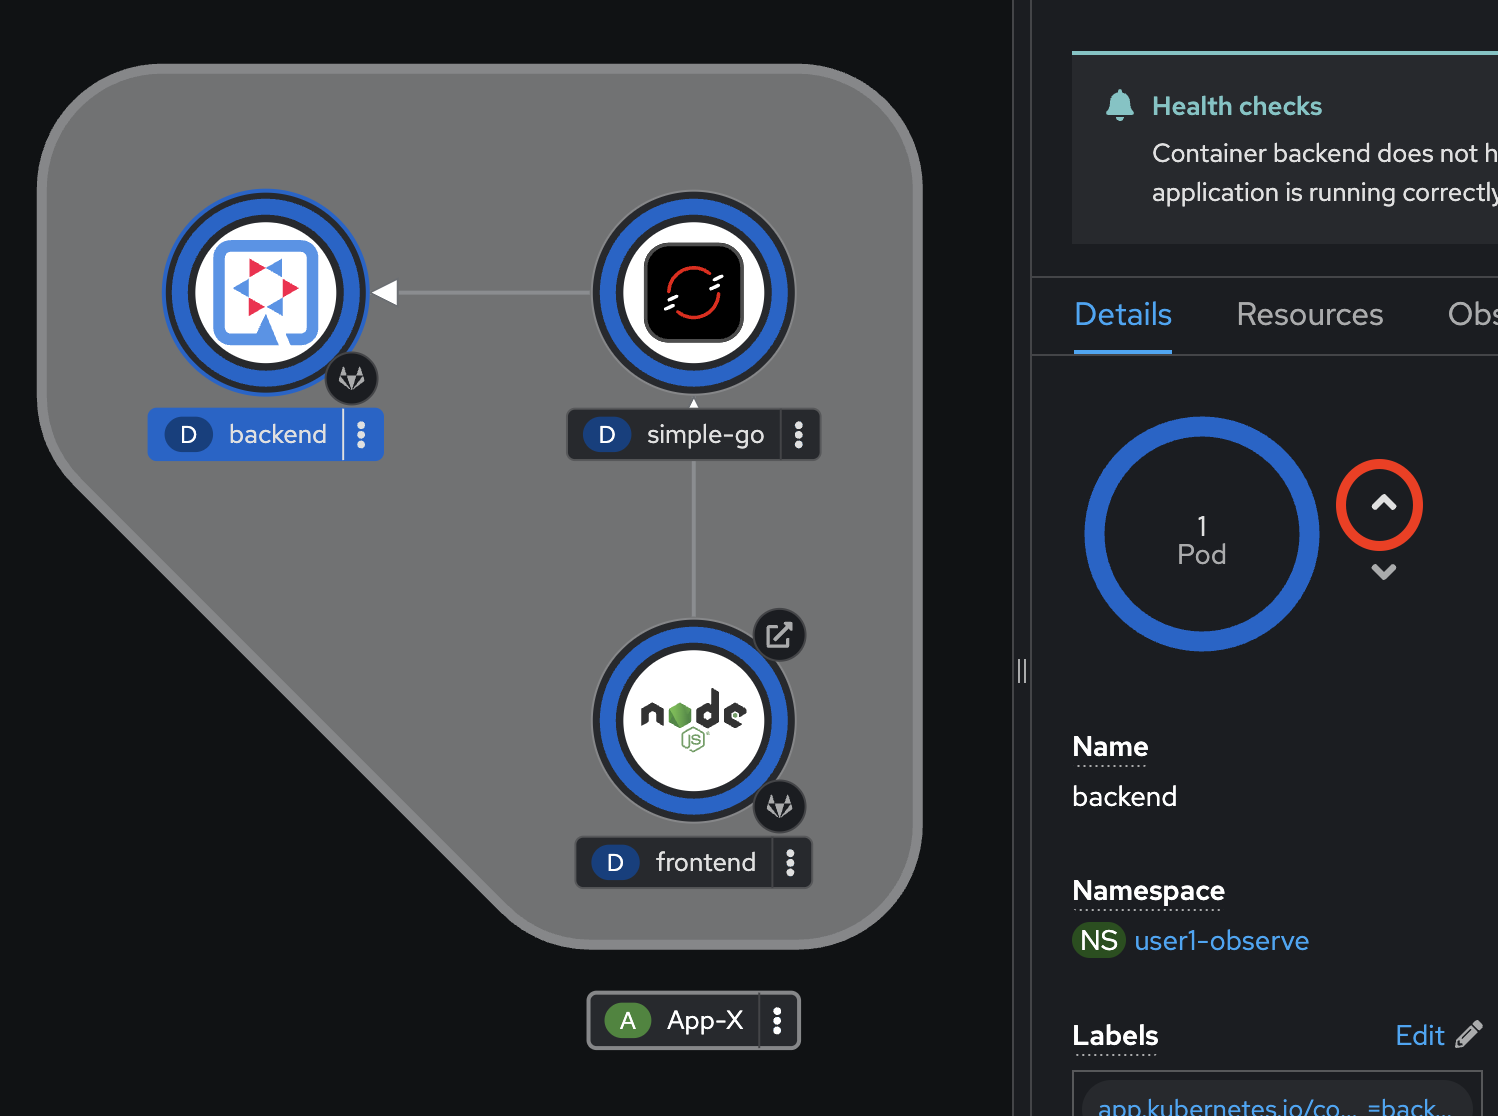
-
Go to the Resources tab and view the
backendapplication logs again.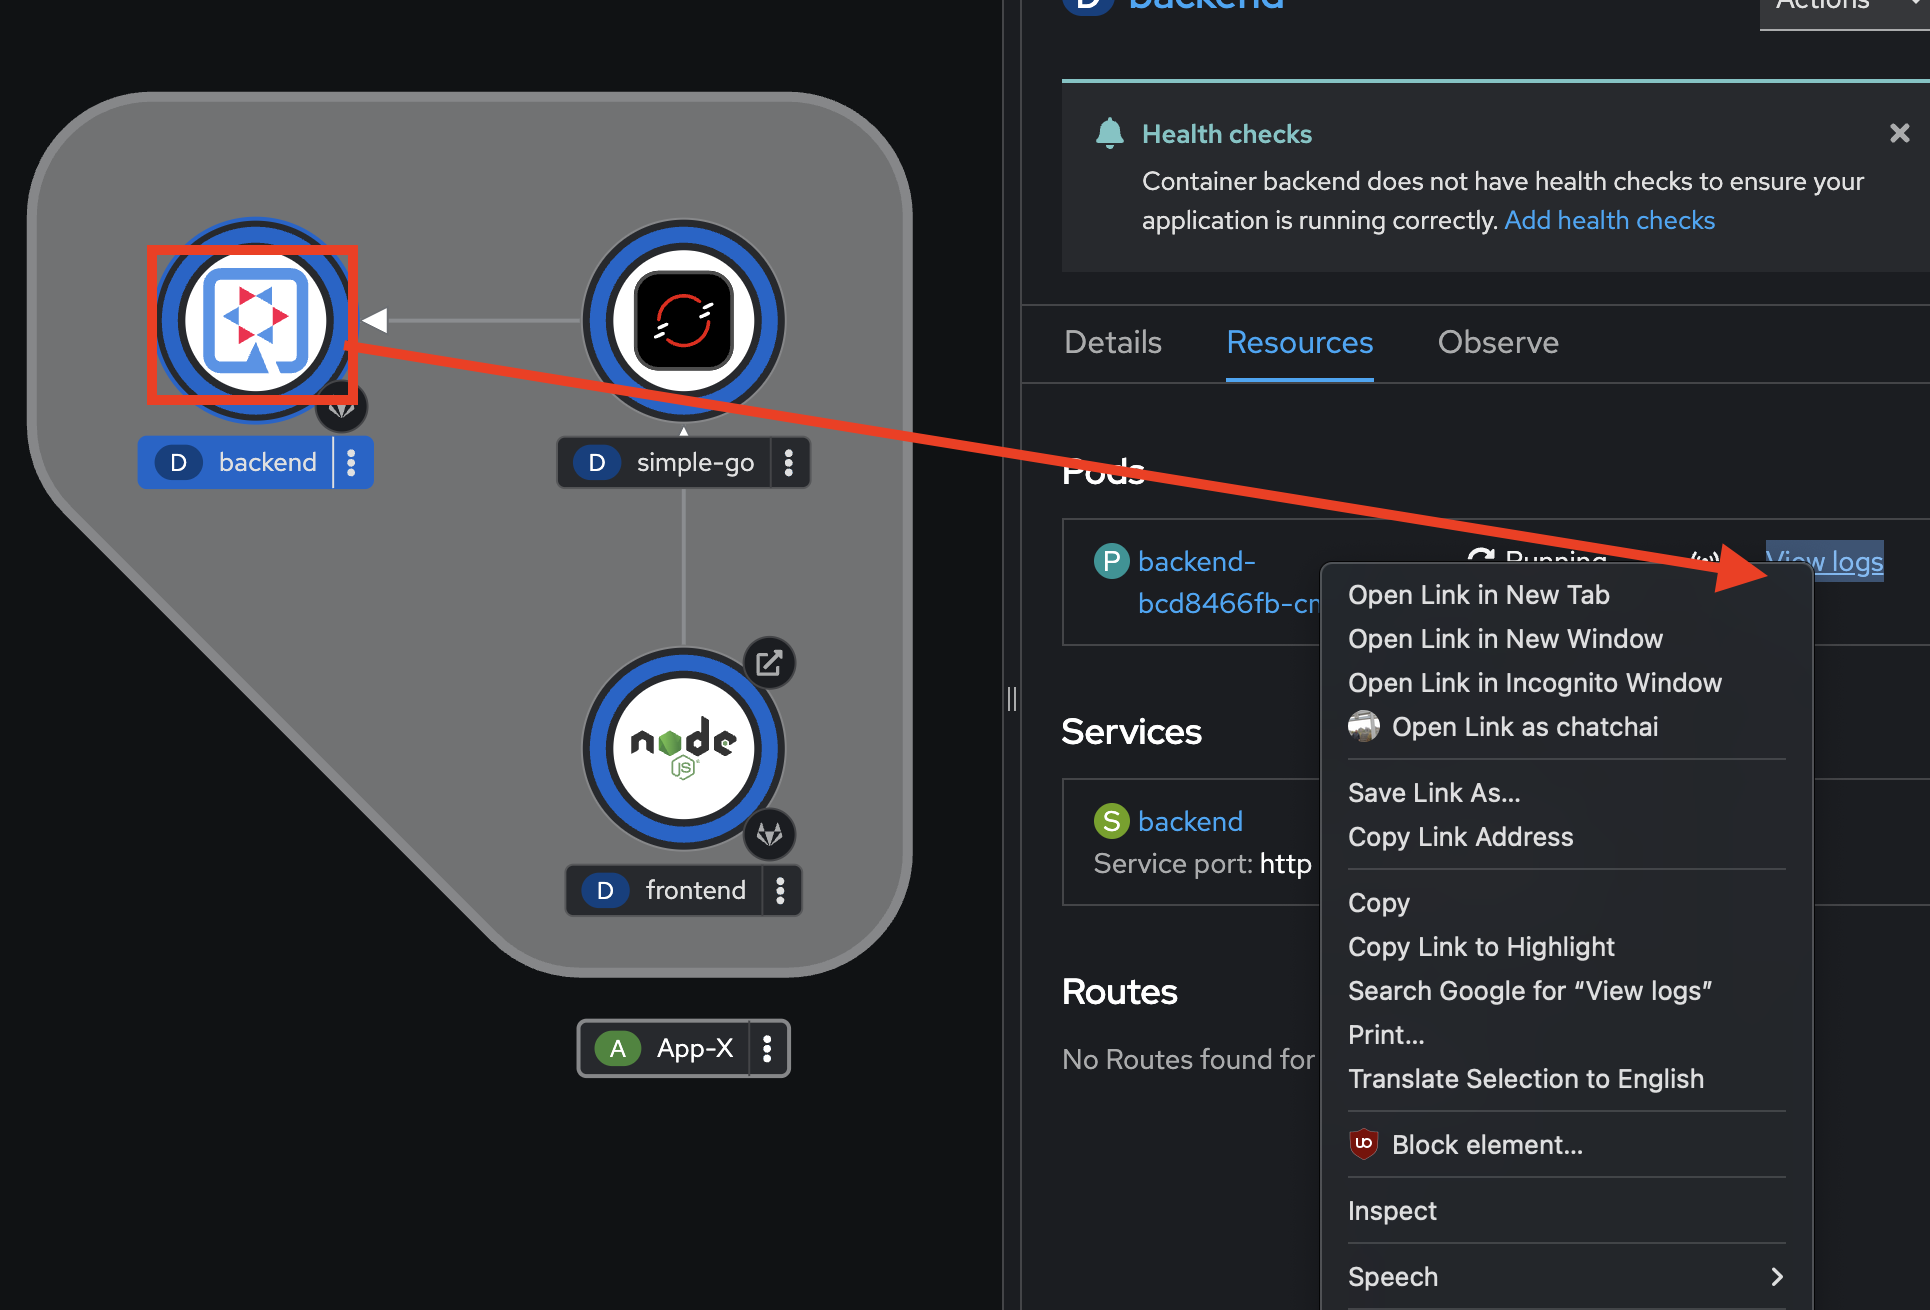
-
You should see that all previous logs now disappear and there are only new logs from the new Pod we’ve just scaled up.
Query Application Logs using OpenShift Logging
In the previous section, you’ve learned how to view application logs in OpenShift web console. Also, you’ve seen that if the application container/Pod got restarted, all the previous logs would disappear.
The question is, how can you view all the previous application logs for problem troubleshooting and diagnostic?
Luckly!, OpenShift Logging has provided the software stack for log management for your applications in the OpenShift cluster. You can store your applications’s logs in the OpenShift cluster for short-term period i.e. 15 - 30 days, then shift all older logs to external log management stack i.e. EFK/ELK for long-term log persistent.
OpenShift Logging comes with web console plug-in that provides the UI to view and query logs stored in the OpenShift cluster.
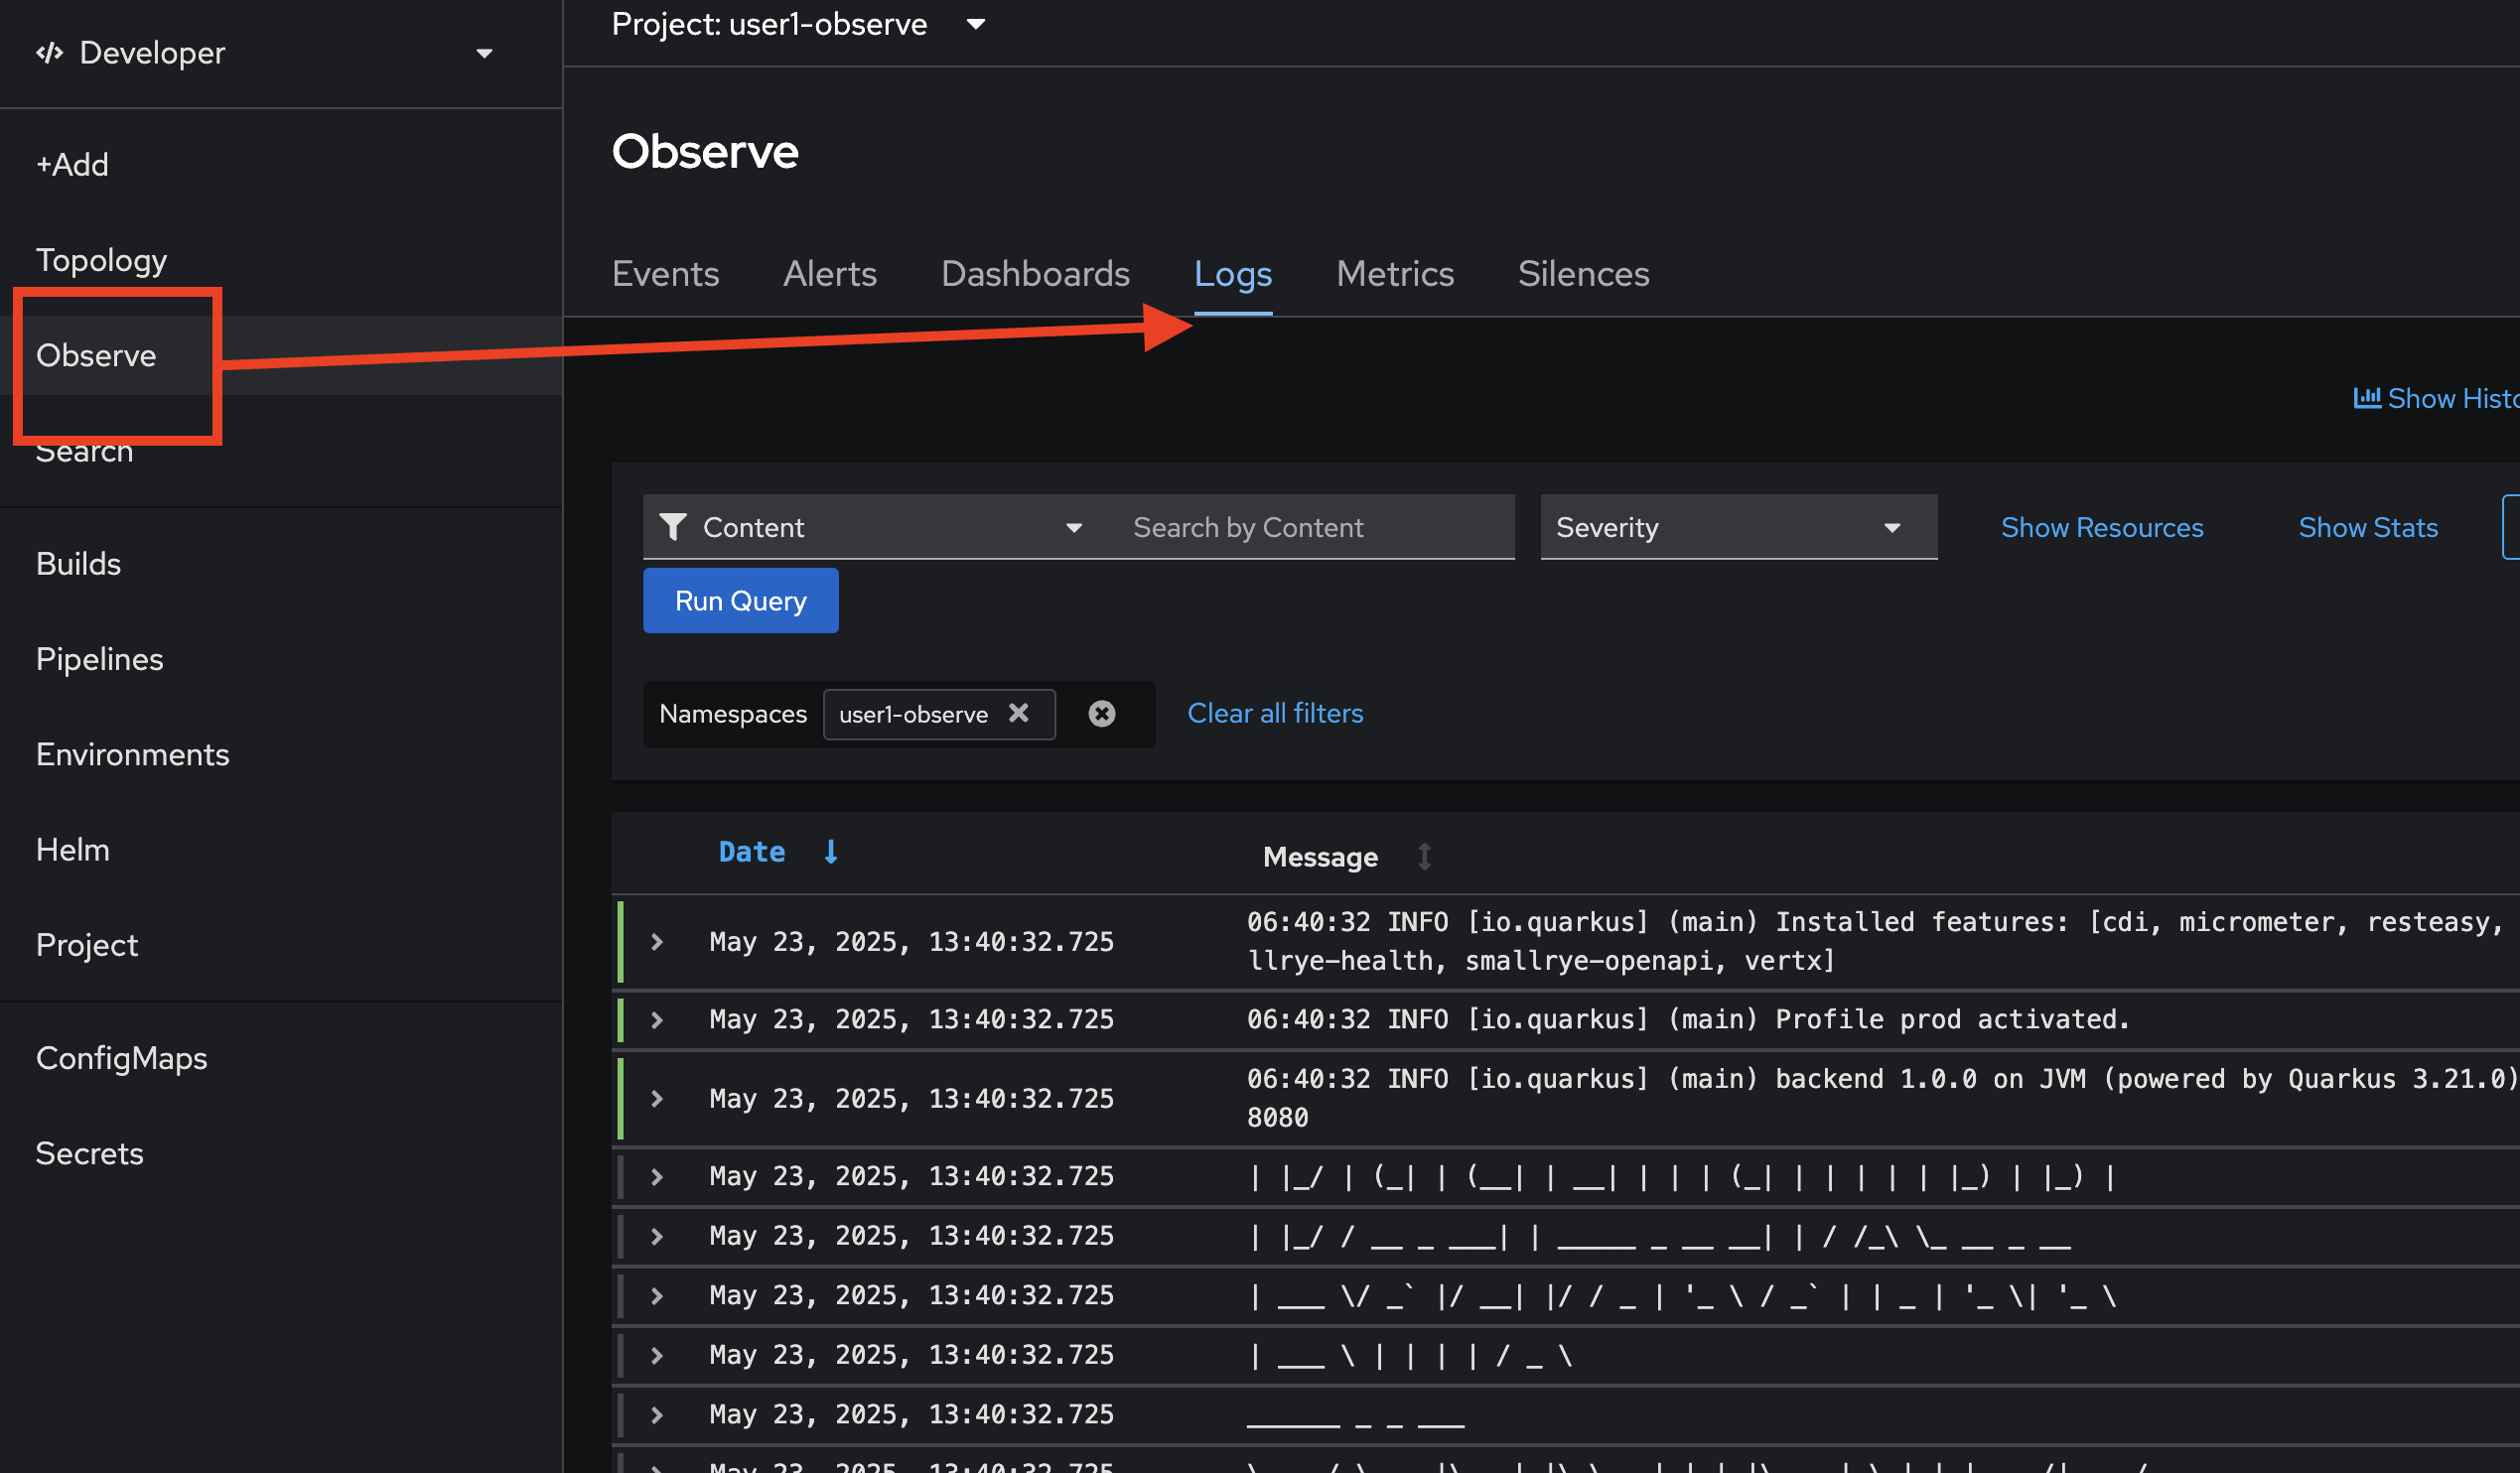
-
Go to Observe menu, select Logs tab to view all logs from all applications in a particular project.
-
Try to fileter with Pods, select all
backendpods then click Run Query Button.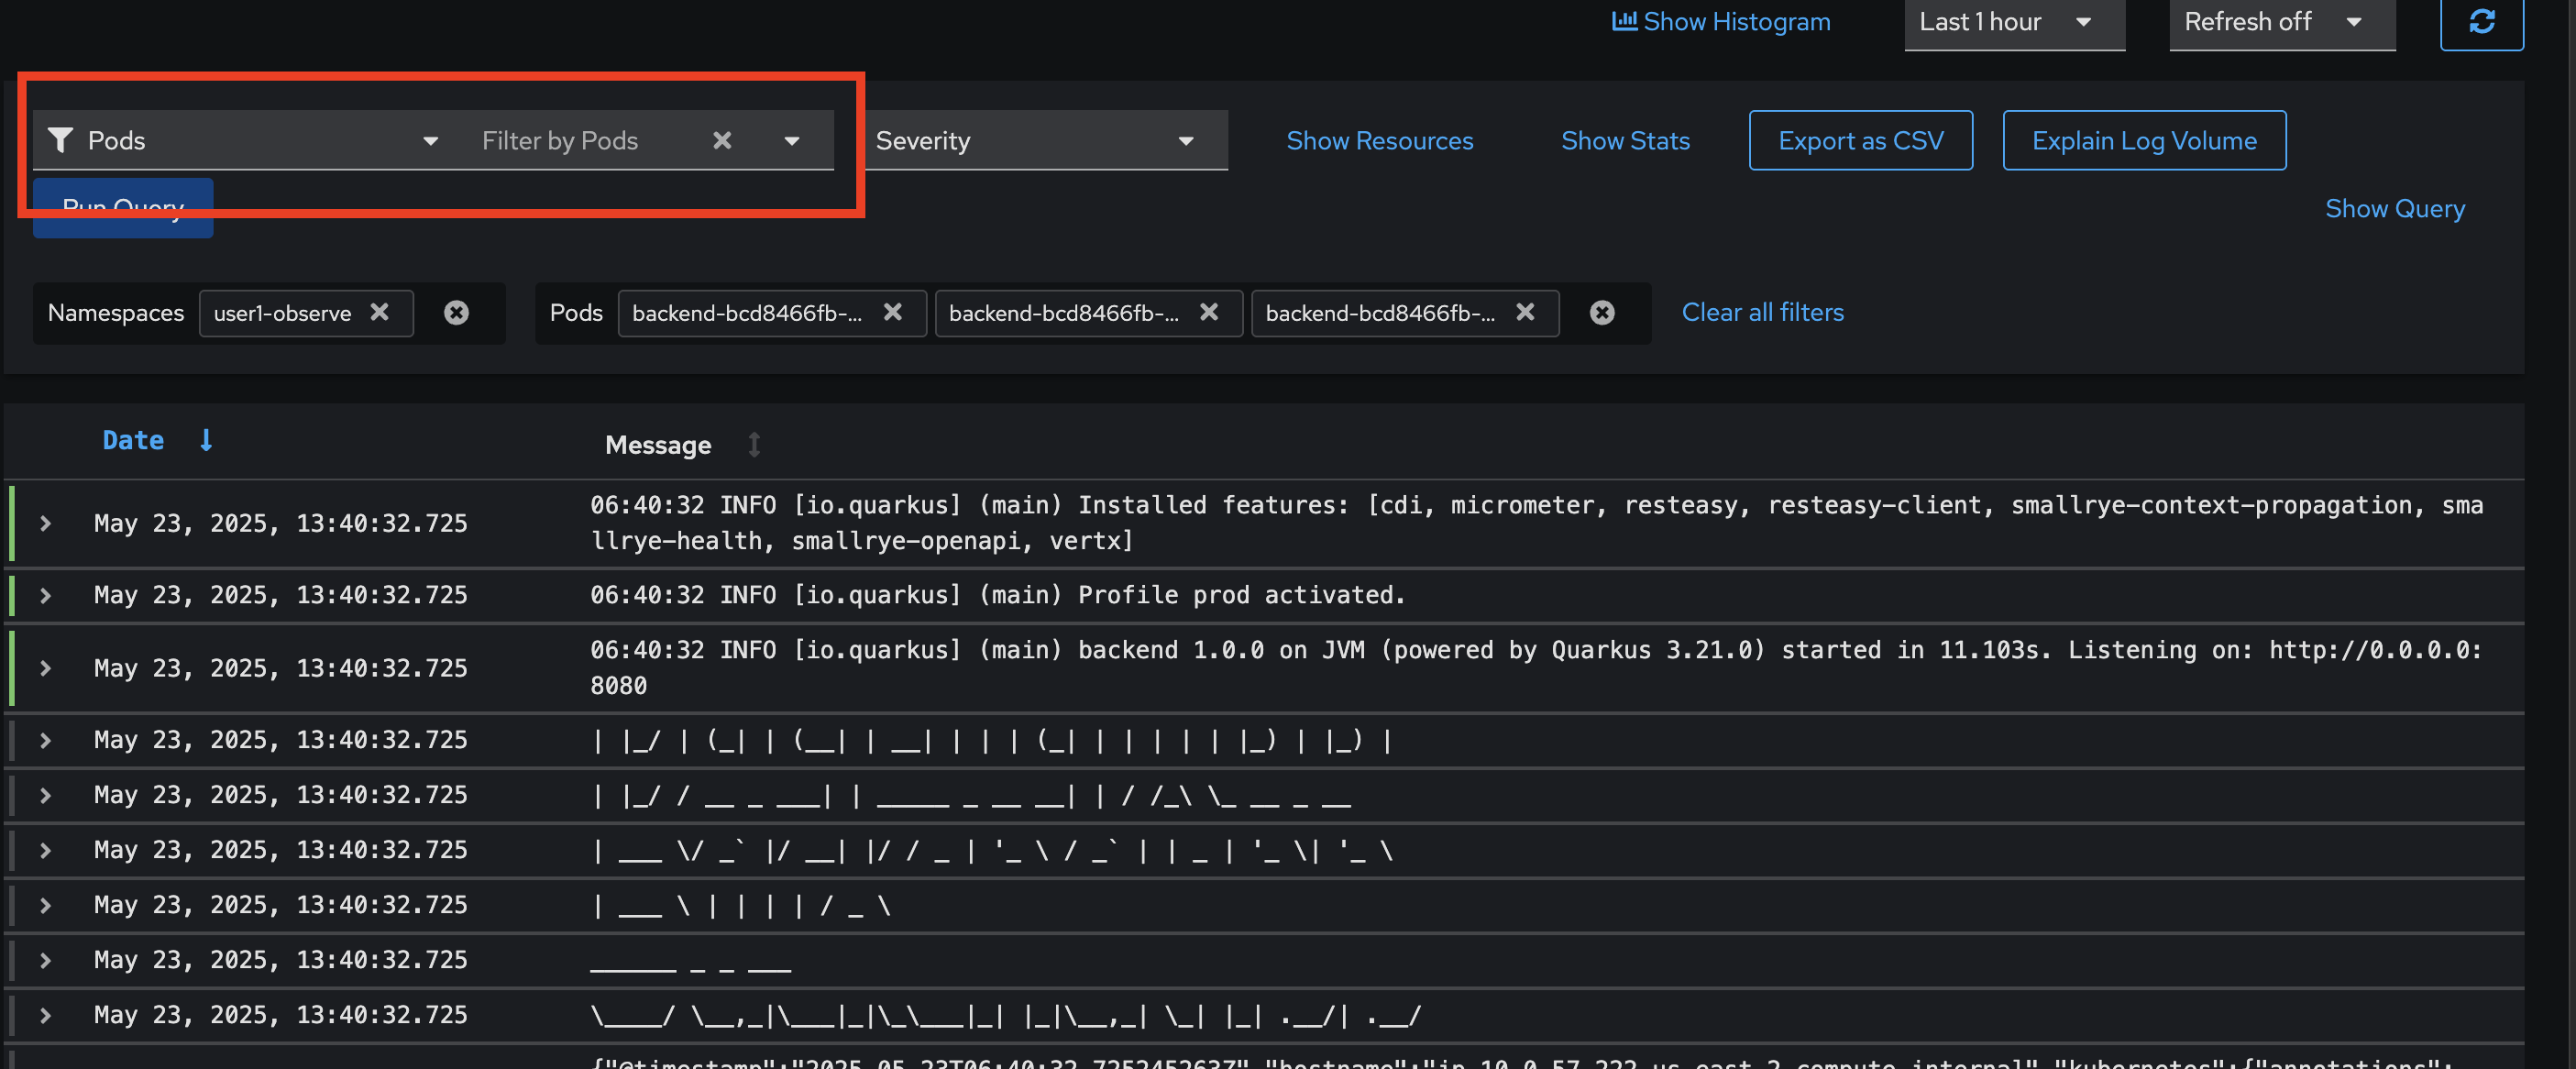
-
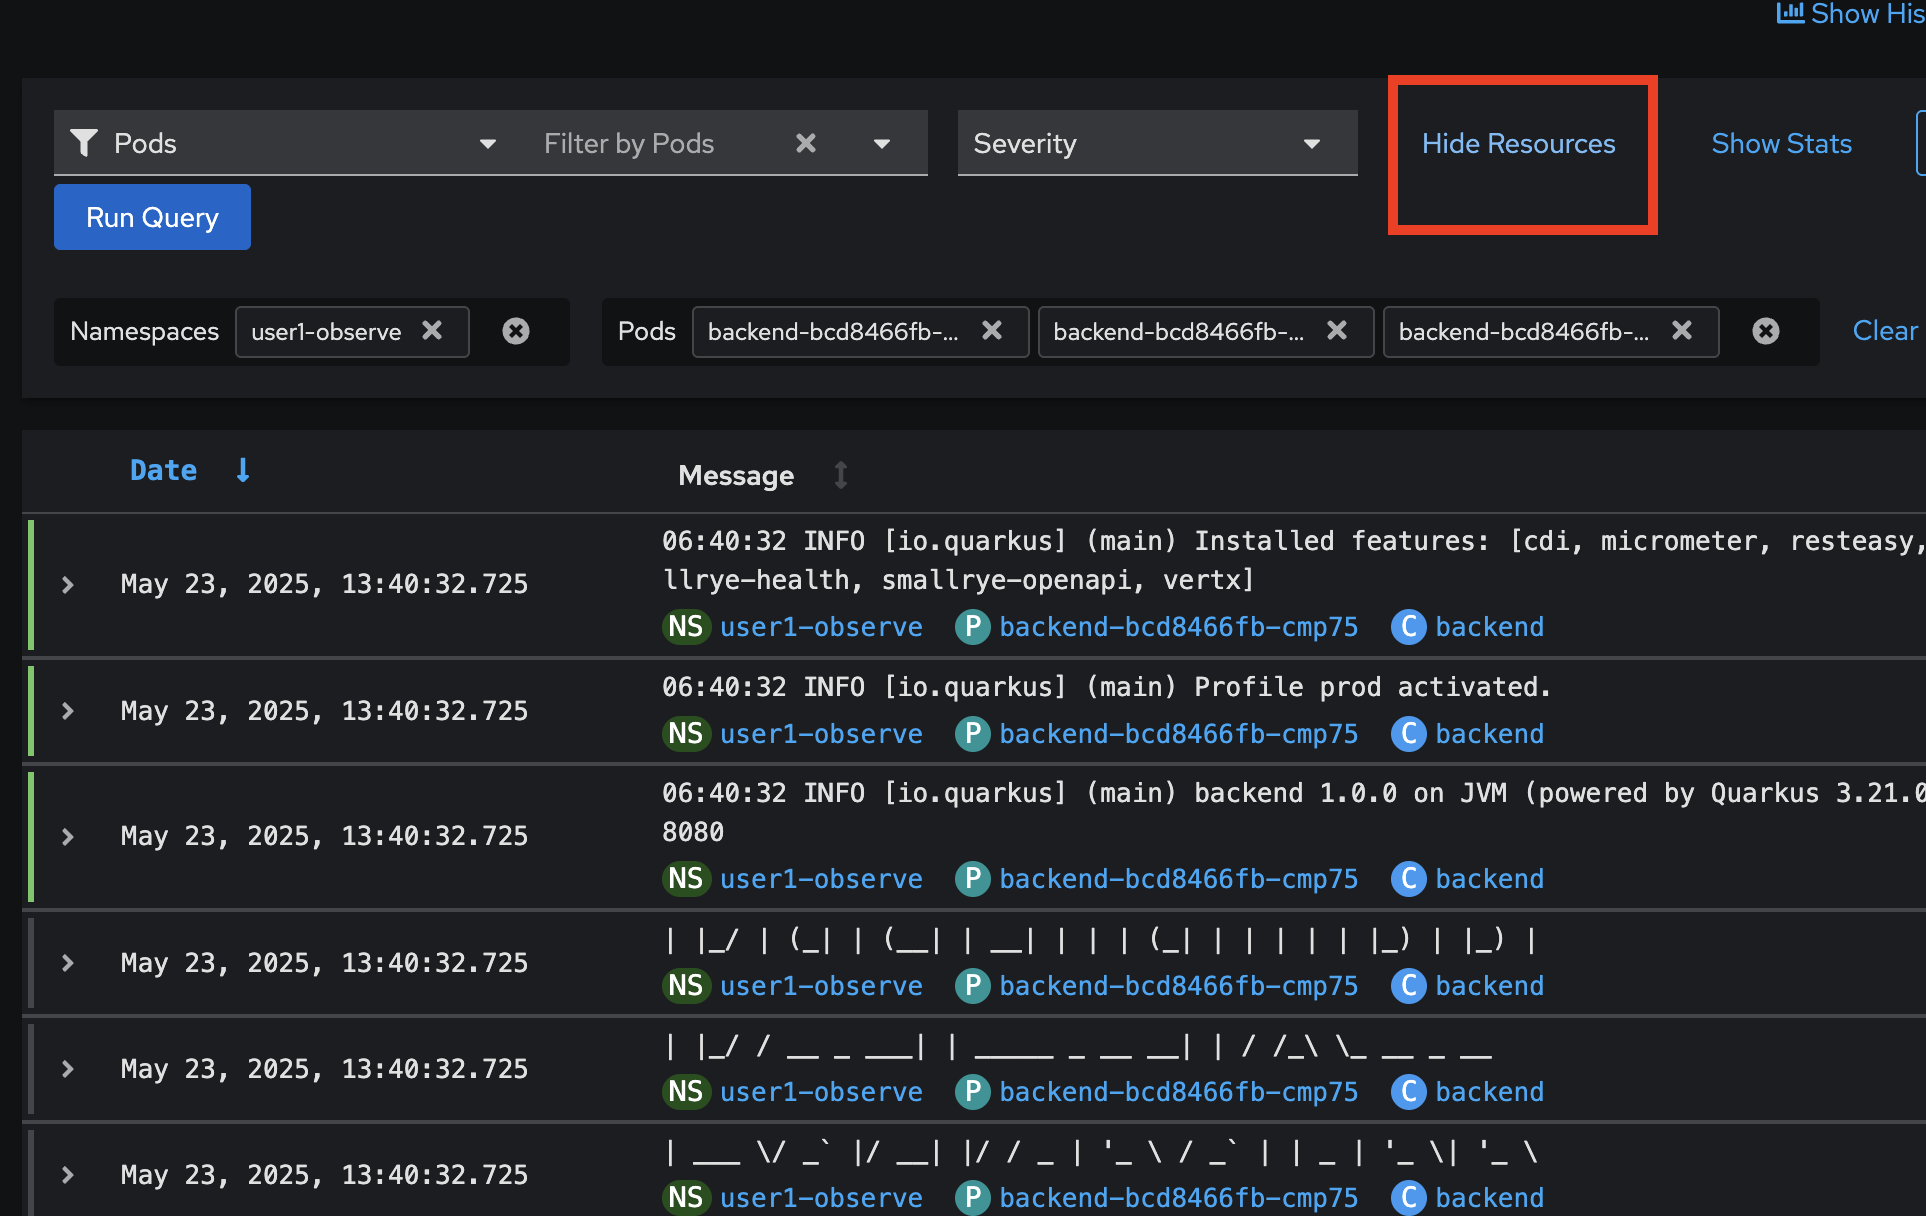
Click on Show Resources or Hide Resources link, to show/hide log’s metadata e.g. Namespace/Project, Pod, and Container from which the log was produced.
-
Now let’s try logs query using LogQL language. First, click Clear all filters to clear all filters, then click Show Query to open logs query input.
Copy this query and past to the input text box then click Run Query button. The query statement is used to query all logs from the
backendcontainer inuserX-observenamespace/Project.Change the
userX-observein the query to matches to your username.{ log_type="application", kubernetes_namespace_name="userX-observe", kubernetes_container_name=~"backend" } | json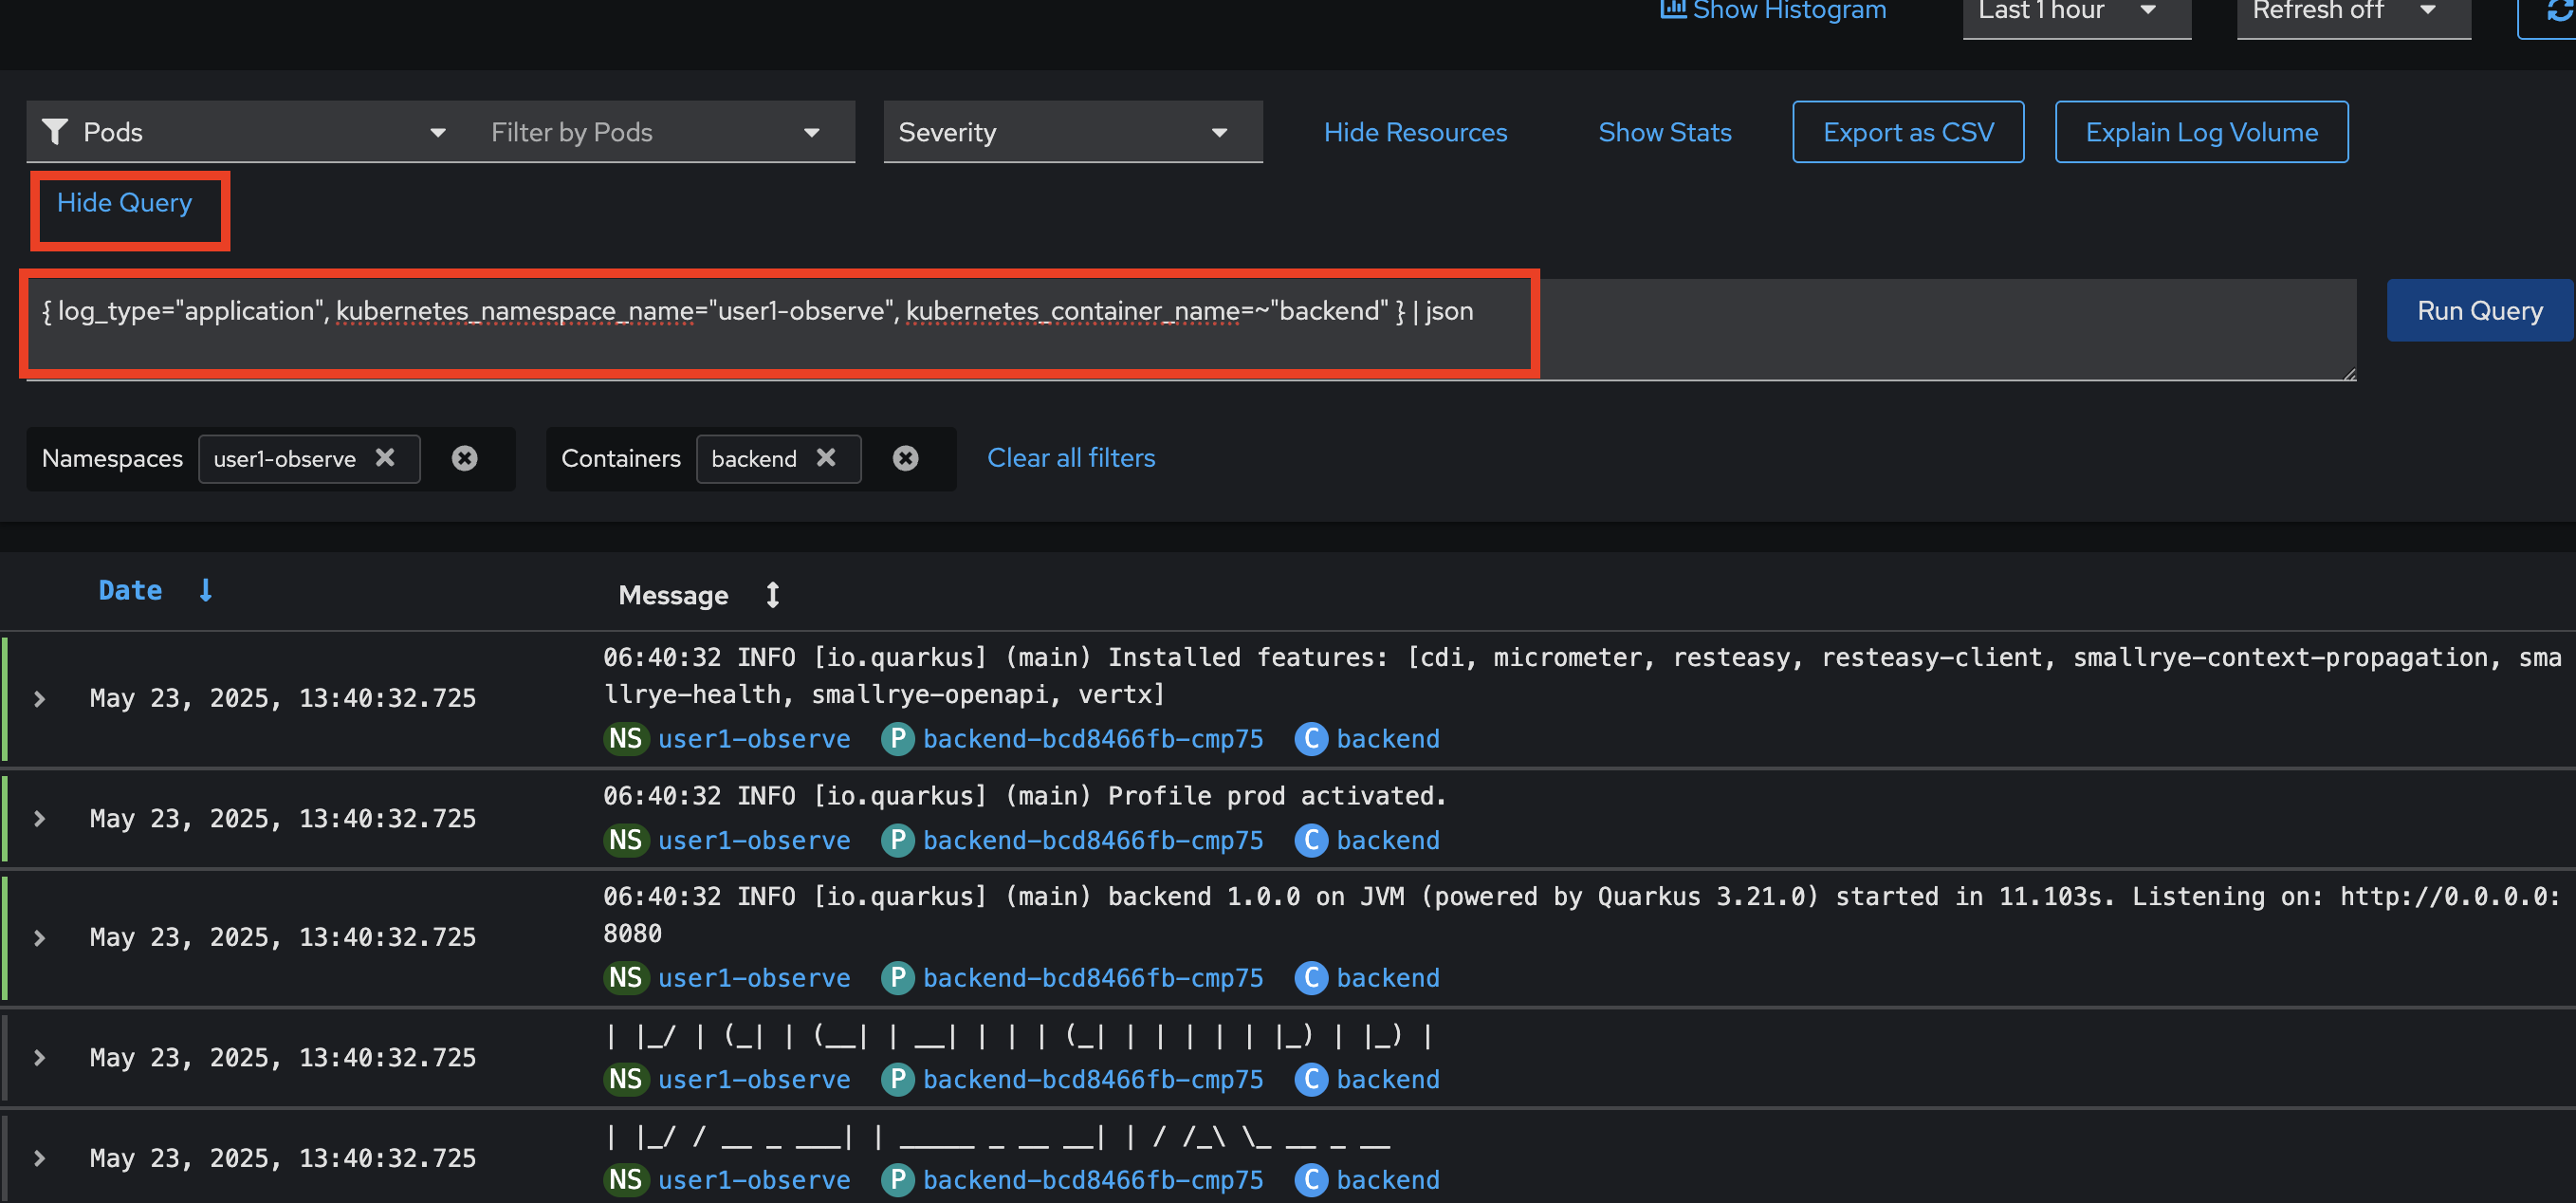
-
Next, try another query to find all logs coming from the
BackendResource.javaclass.Change the
userX-observein the query to matches to your username.{ log_type="application", kubernetes_namespace_name="userX-observe" } |= "BackendResource" | json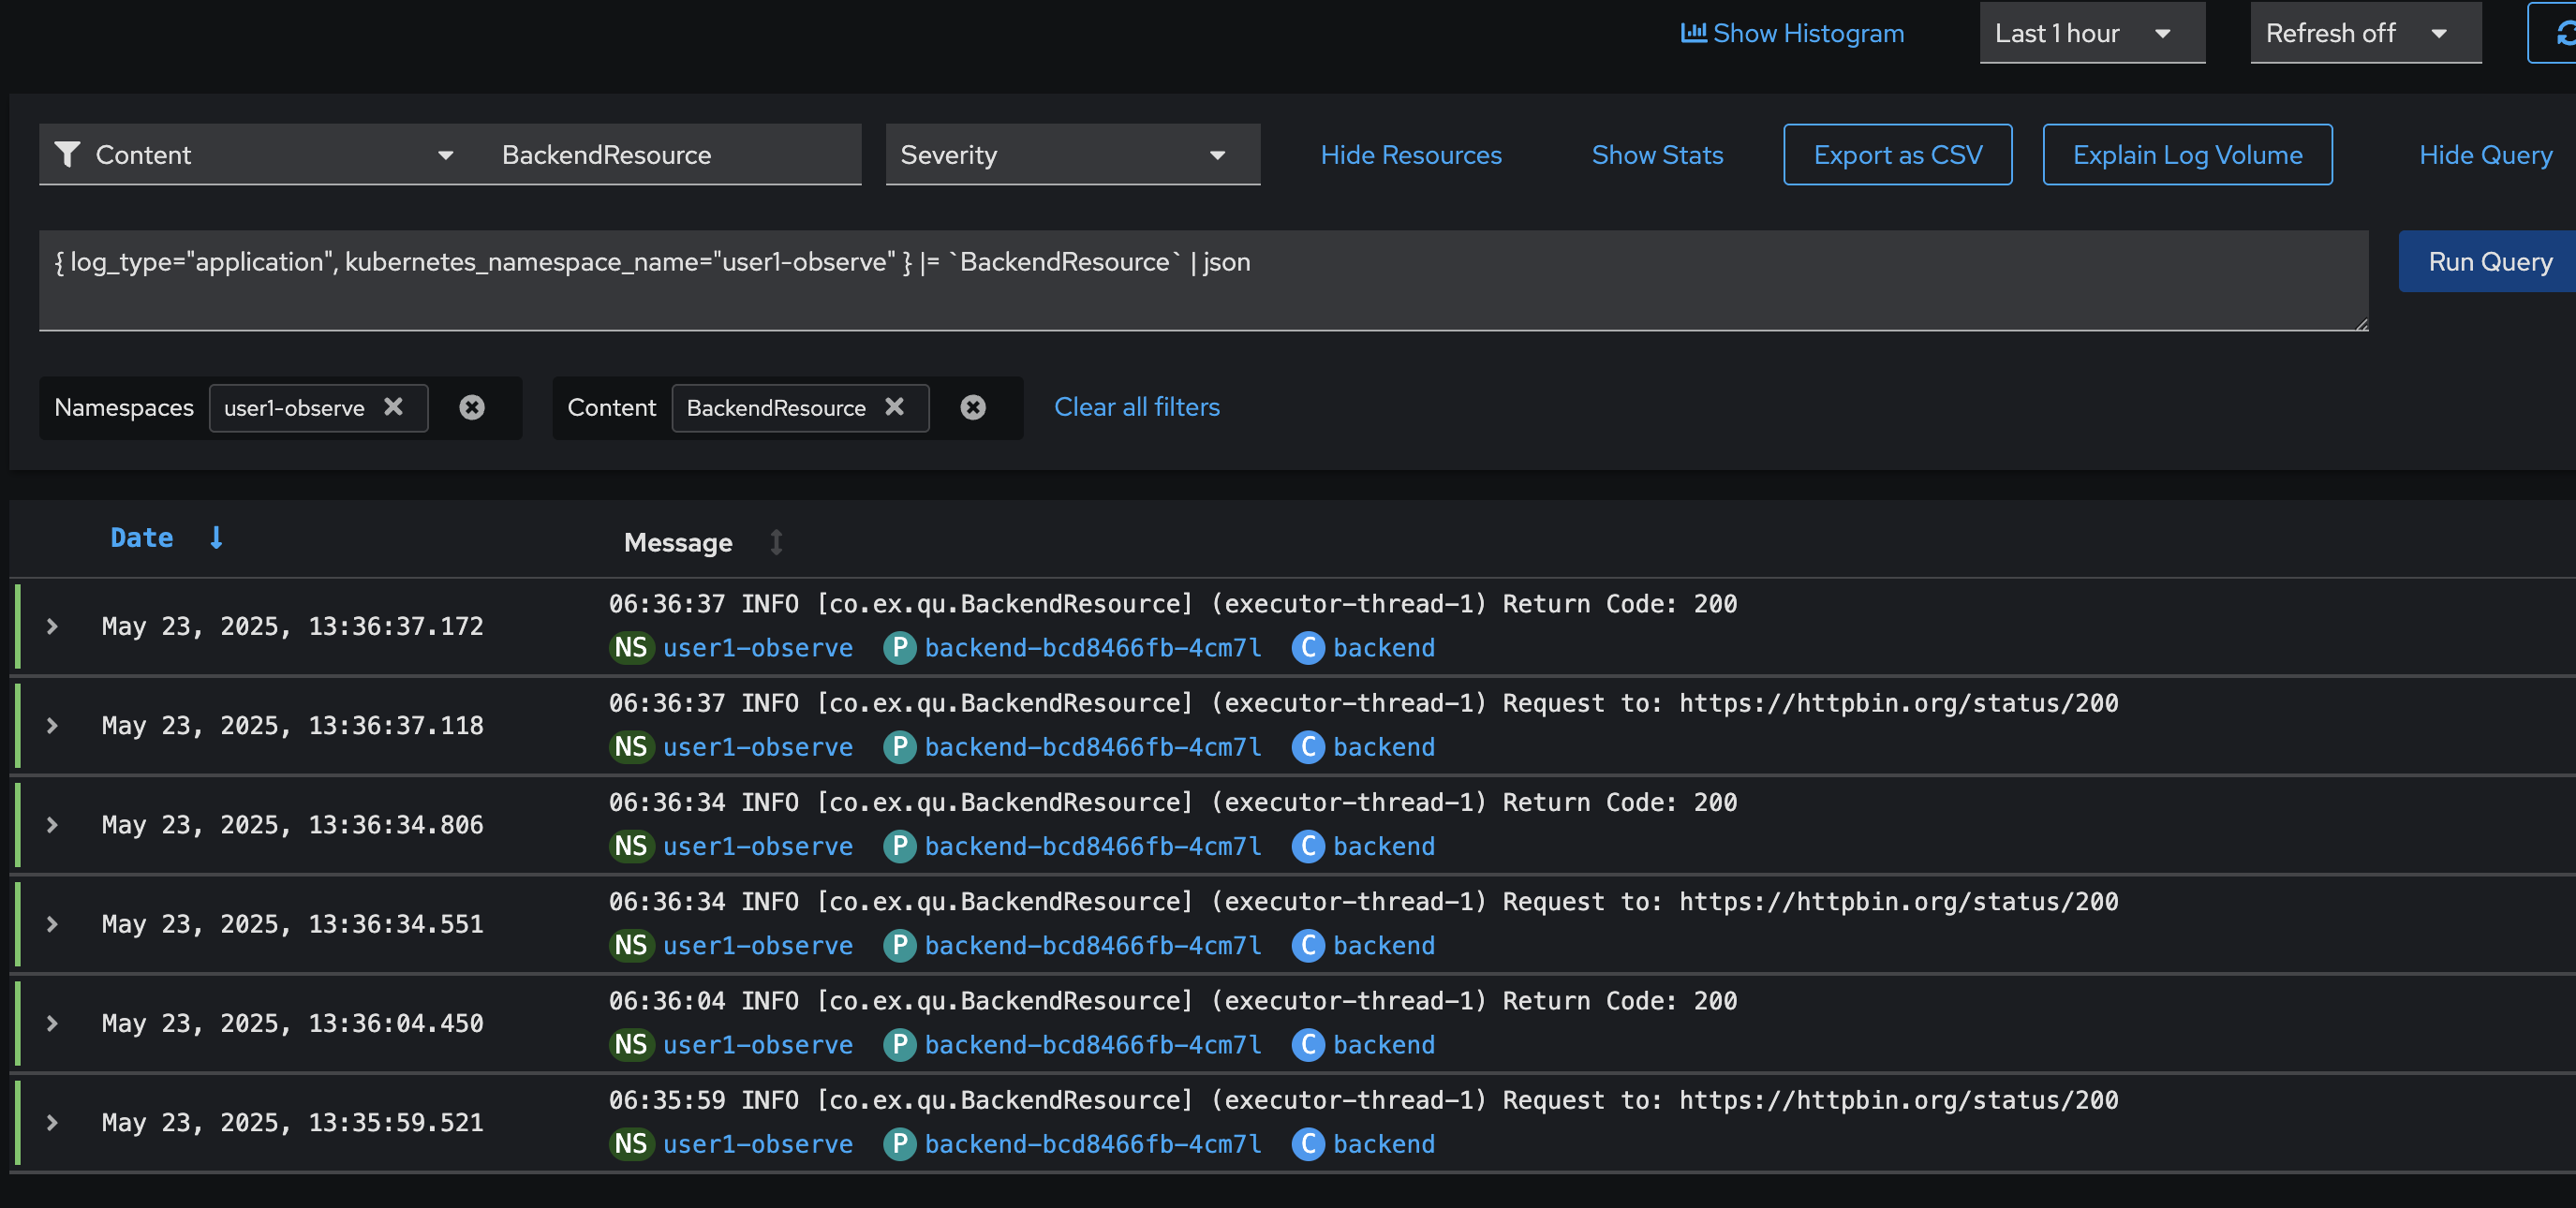
Summary
OpenShift’s logging capabilities offer significant benefits for containerized applications and overall platform management. These benefits include centralized log collection, enhanced security and compliance, and streamlined troubleshooting and debugging. OpenShift’s logging features streamline the development process by providing a consistent and standardized approach to logging.