Live Flight Tracker Demo
Architecture of the demo
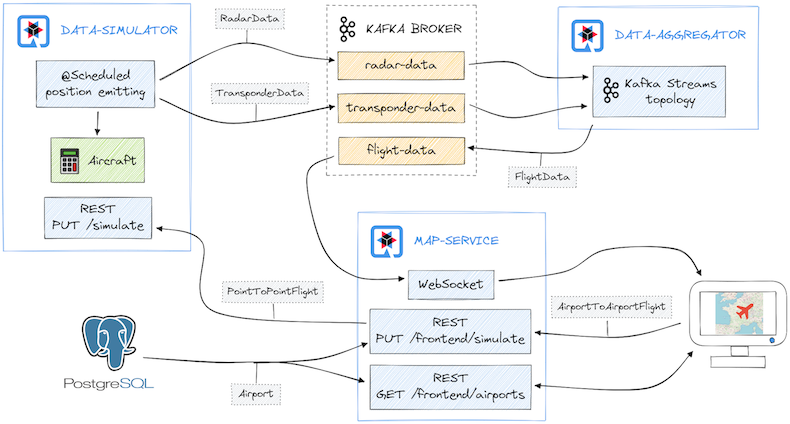
- map-service: web application with websocket, rest api for interact with browser for show and receive command for simulate live flight tracker
- postgresql: relational database for airport data
- data-simulator: backend service for simulation live flight (simulate radar data and transponder data to kafka)
- kafka broker: messaging system for integrate data between system
- data-aggregator: streams processing service for aggregate (merge) radar data and transponder data to flight data and put it back to kafka for display from map service
Step by Step to Deploy Live Flight Tracker on OpenShift
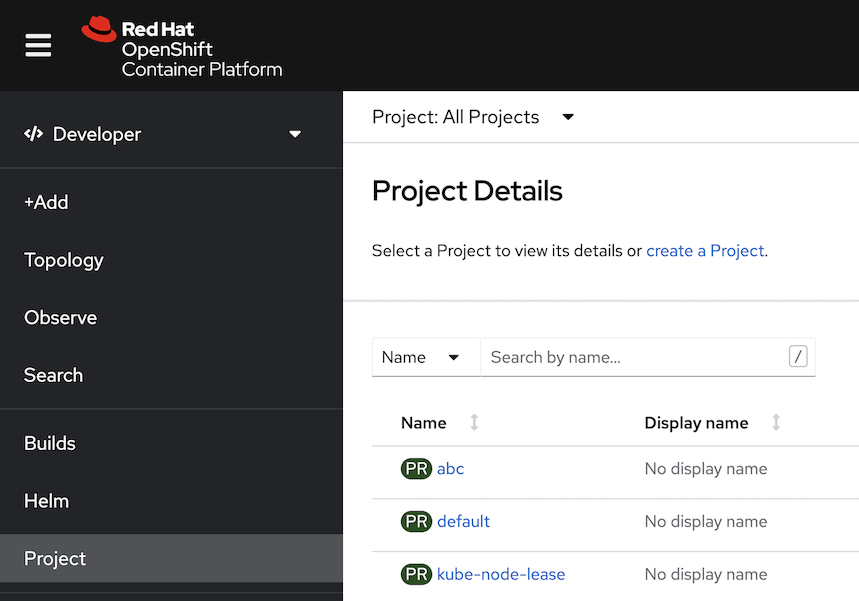
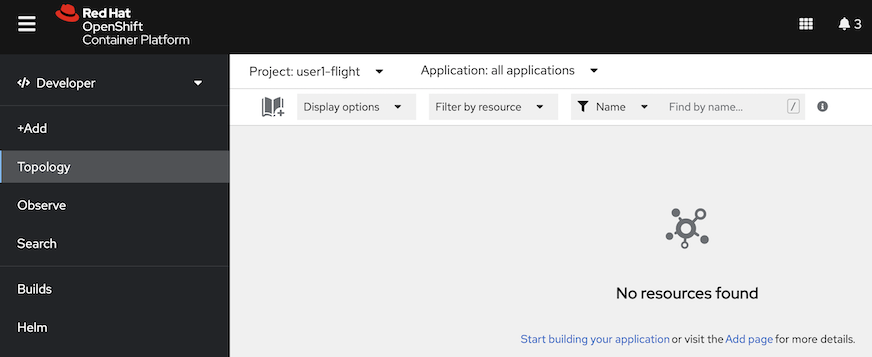
Create Project for Live Flight Tracker
open openshift developer perspective, click "Project" from left menu, click "create a Project"
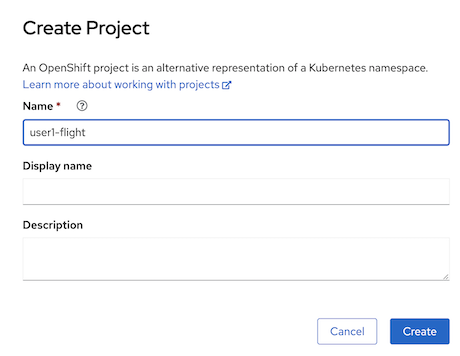
in create project panel,
- set Name:
-flight such as "user1-flight" click "create"
- set Name:
Create Kafka on OpenShift
- click Topology in left menu
- click add icon (book with plus sign, right top, near Display options)
type "kafka" in search box, select "Kafka" and click Create
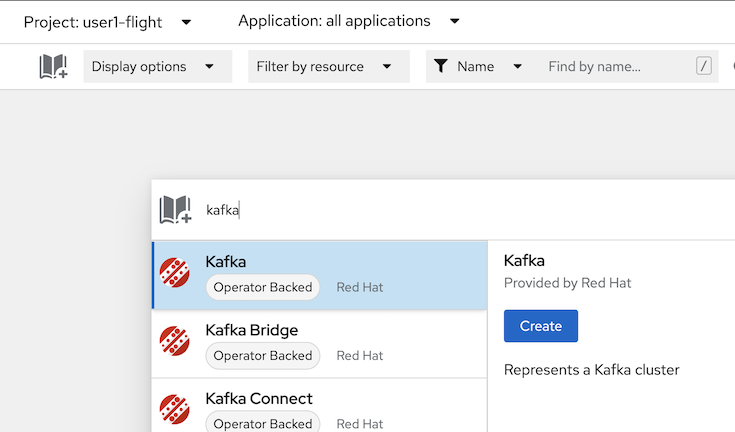
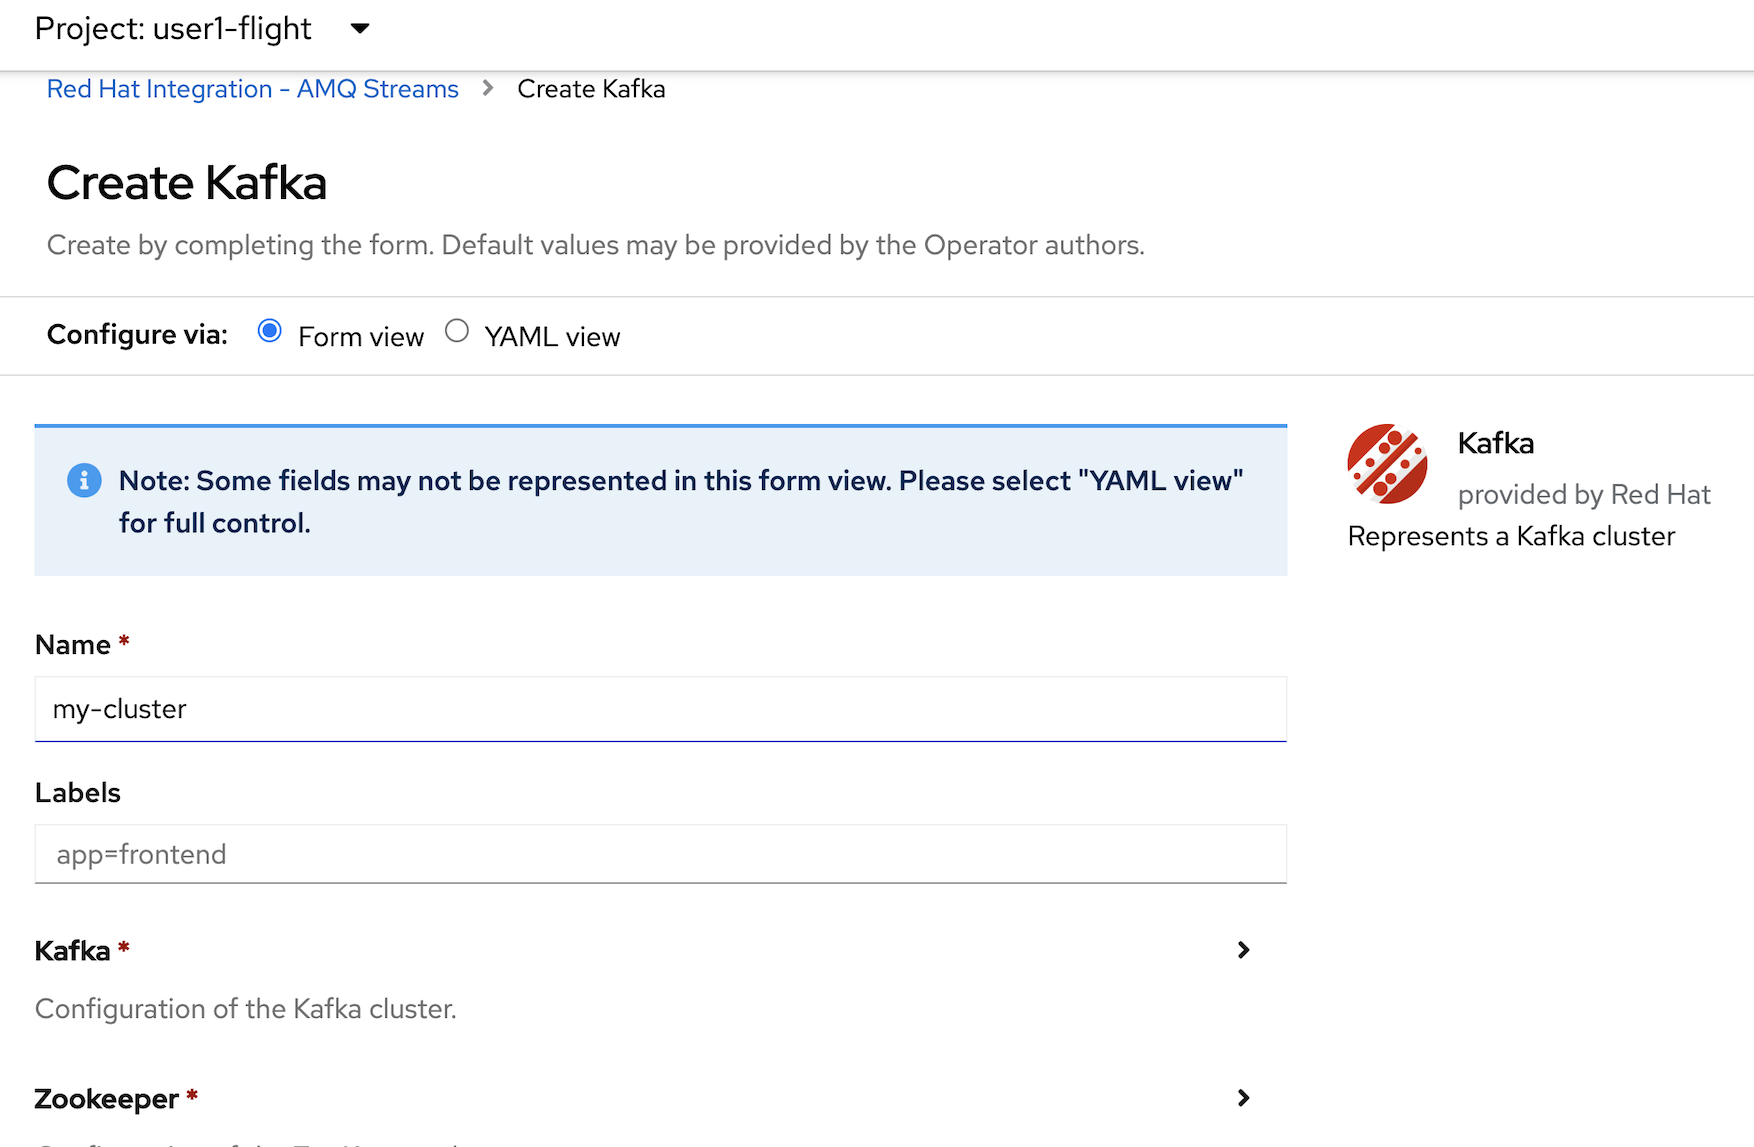
in Create Kafka, leave all default, click create
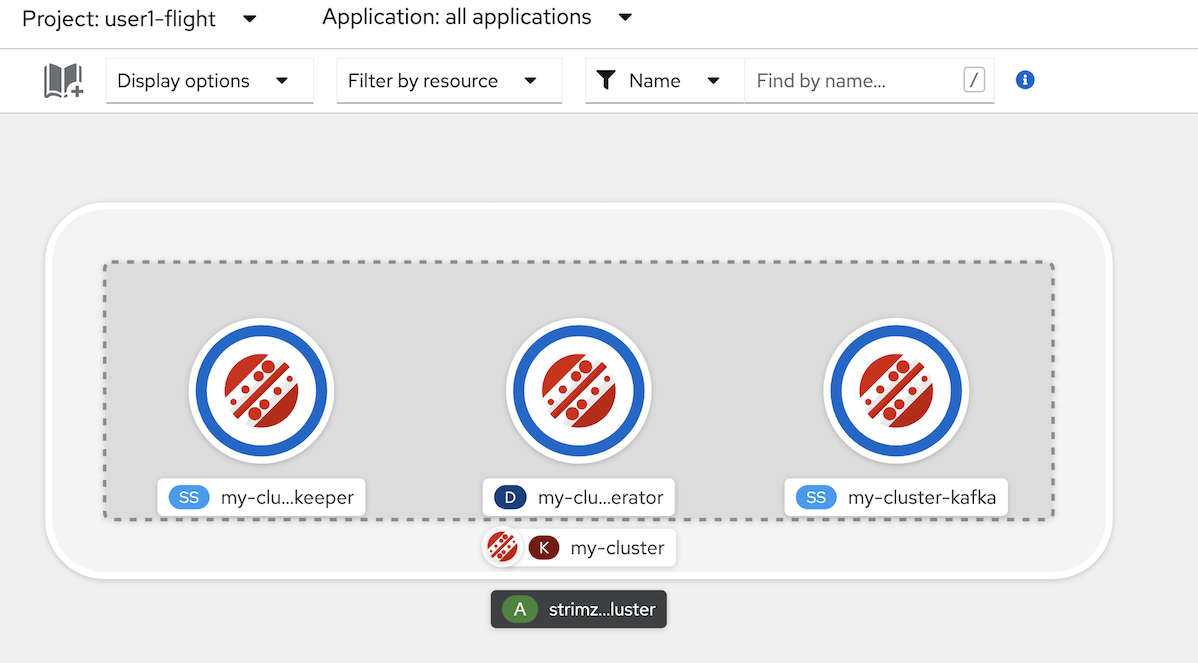
wait until kafka complete deployment, you will see 3 deployment in kafka "my-cluster" (wait until all 3 deployment circle change to dark blue)
You can also check status of Kafka cluster by run following command in Terminal
oc get kafka/my-cluster -n <username>-flightOutput
 NAME         DESIRED KAFKA REPLICAS   DESIRED ZK REPLICAS   READY   WARNINGS
 my-cluster   3                        3                     True
Create Topic in kafka
- in Topology, click add icon (book with plus sign, right top, near Display options)
type "topic", select Kafka Topic, click Create
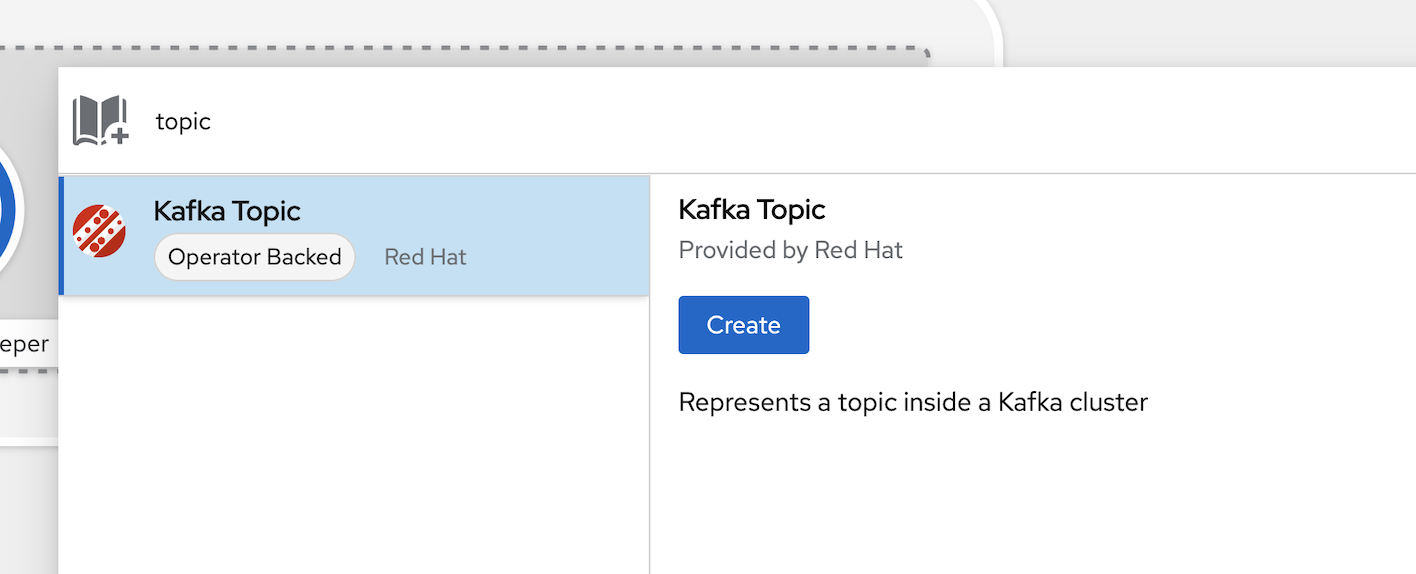
in create kafkatopic panel,
- change Name to "flight-data"
leave other to default, click create
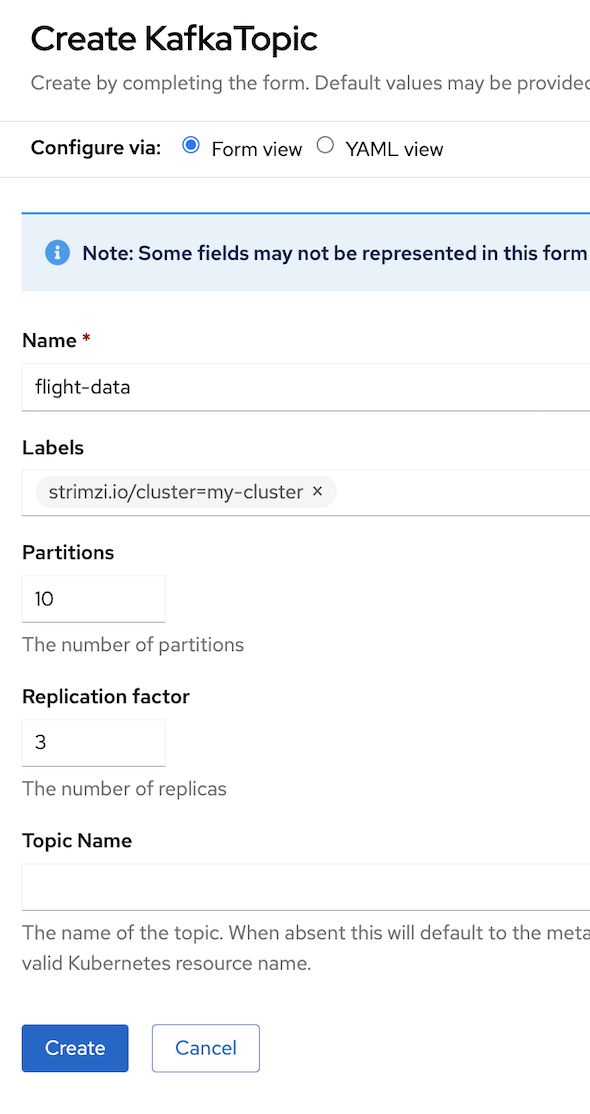
- repeat create kafkatopic with name "radar-data" and "transponder-data"
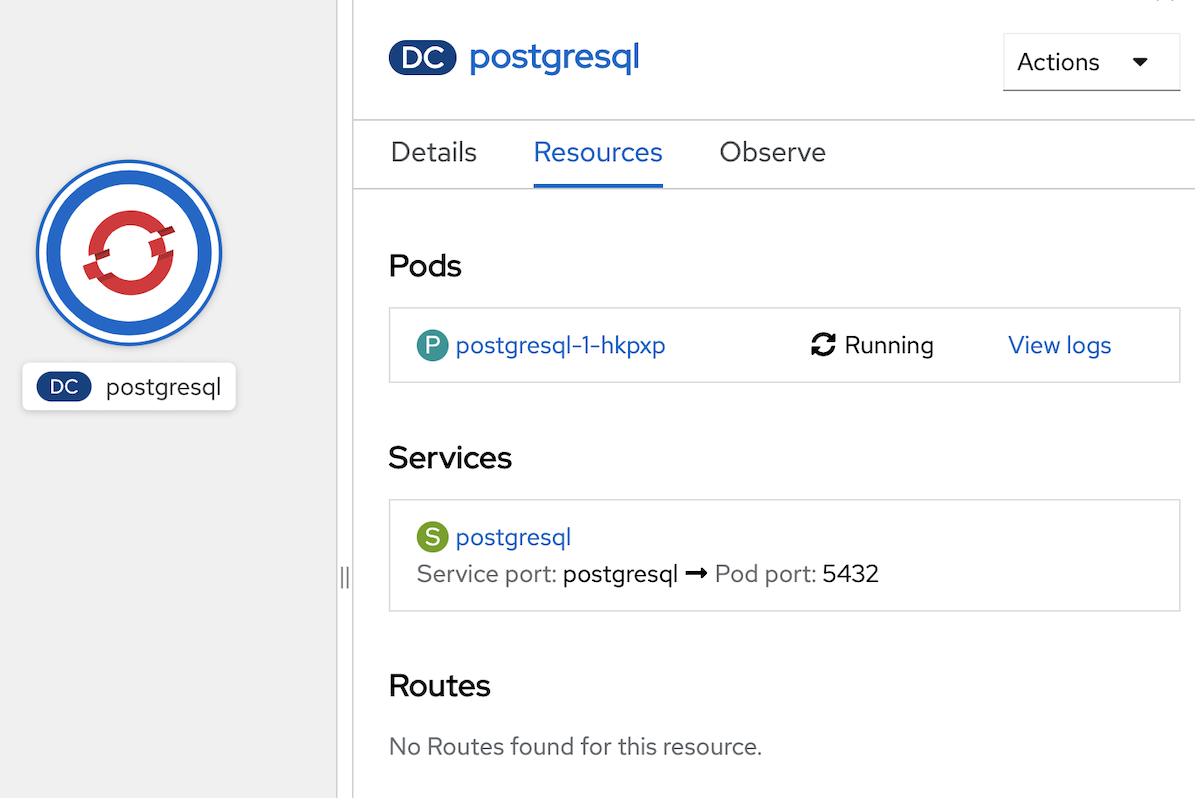
check kafkatopic, in Topology, in my-cluster kafka, click on my-cluster-kafka statefulset (see example in below picture)
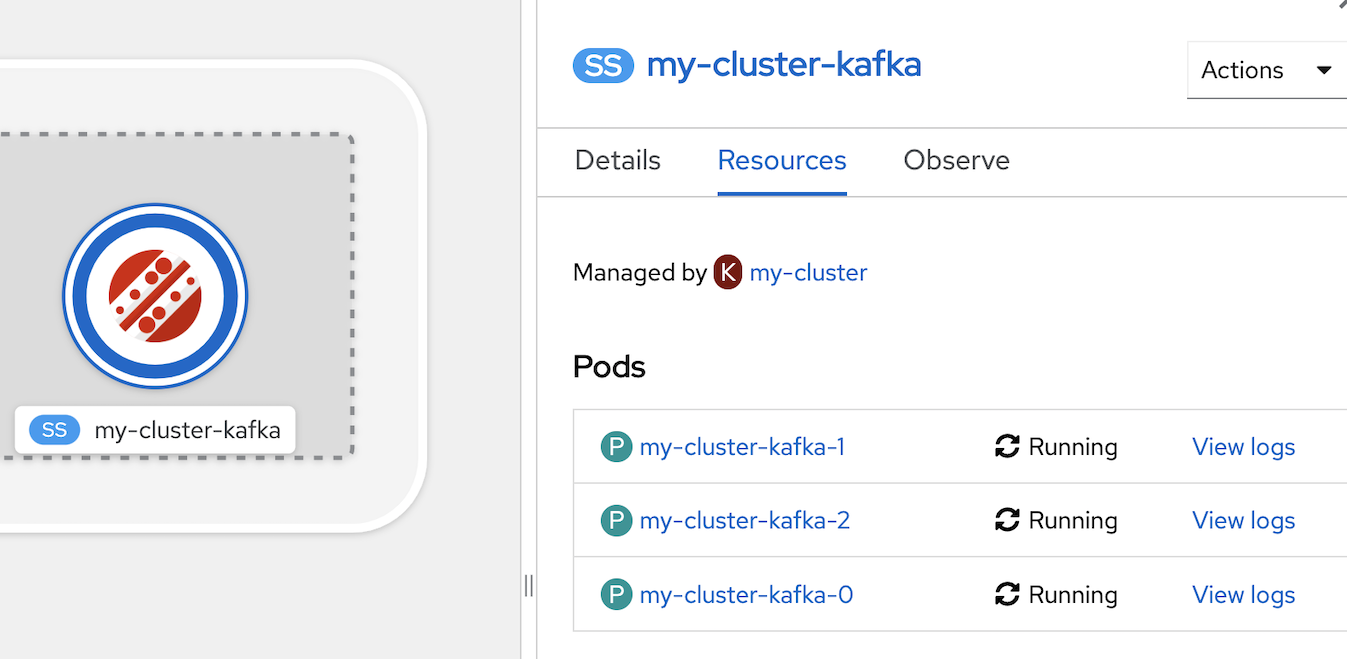
in right panel popup, click in Resources tab, in Pods section, click view logs link in first pod (such as my-cluster-kafka-0)
- after page change to Pod information page, change tab from Logs to Terminal
openshift will open terminal to pod, in terminal type below commond to check topic in kafka (flight-data, radar-data, transponder-data)
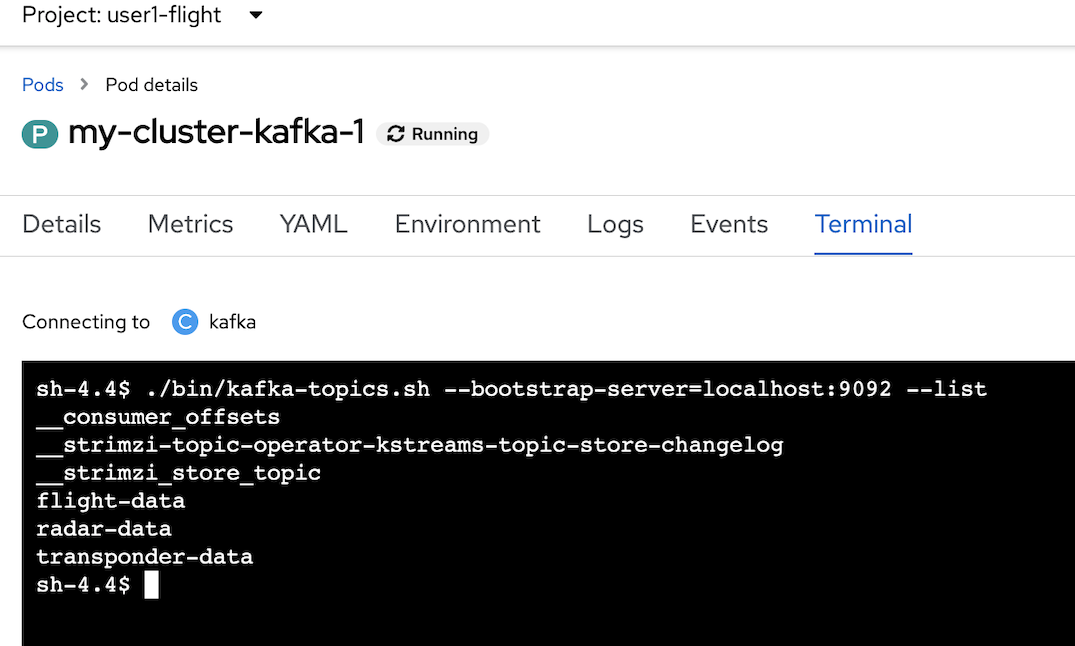
./bin/kafka-topics.sh --bootstrap-server=localhost:9092 --listsample output (if you create correct!)
__consumer_offsets
__strimzi_store_topic
flight-data
radar-data
transponder-data
Alternatively, you can also use Web Terminal with following command to check for topic
oc describe kafkatopic/flight-data -n <username>-flightsample output
 ...
 Spec:
 Config:
    retention.ms:   604800000
    segment.bytes:  1073741824
 Partitions:       10
 Replicas:         3
 Topic Name:       flight-data
 Status:
 Conditions:
    Last Transition Time:  2022-08-24T11:08:29.292182Z
    Status:                True
    Type:                  Ready
 ...
Create Database Postgresql
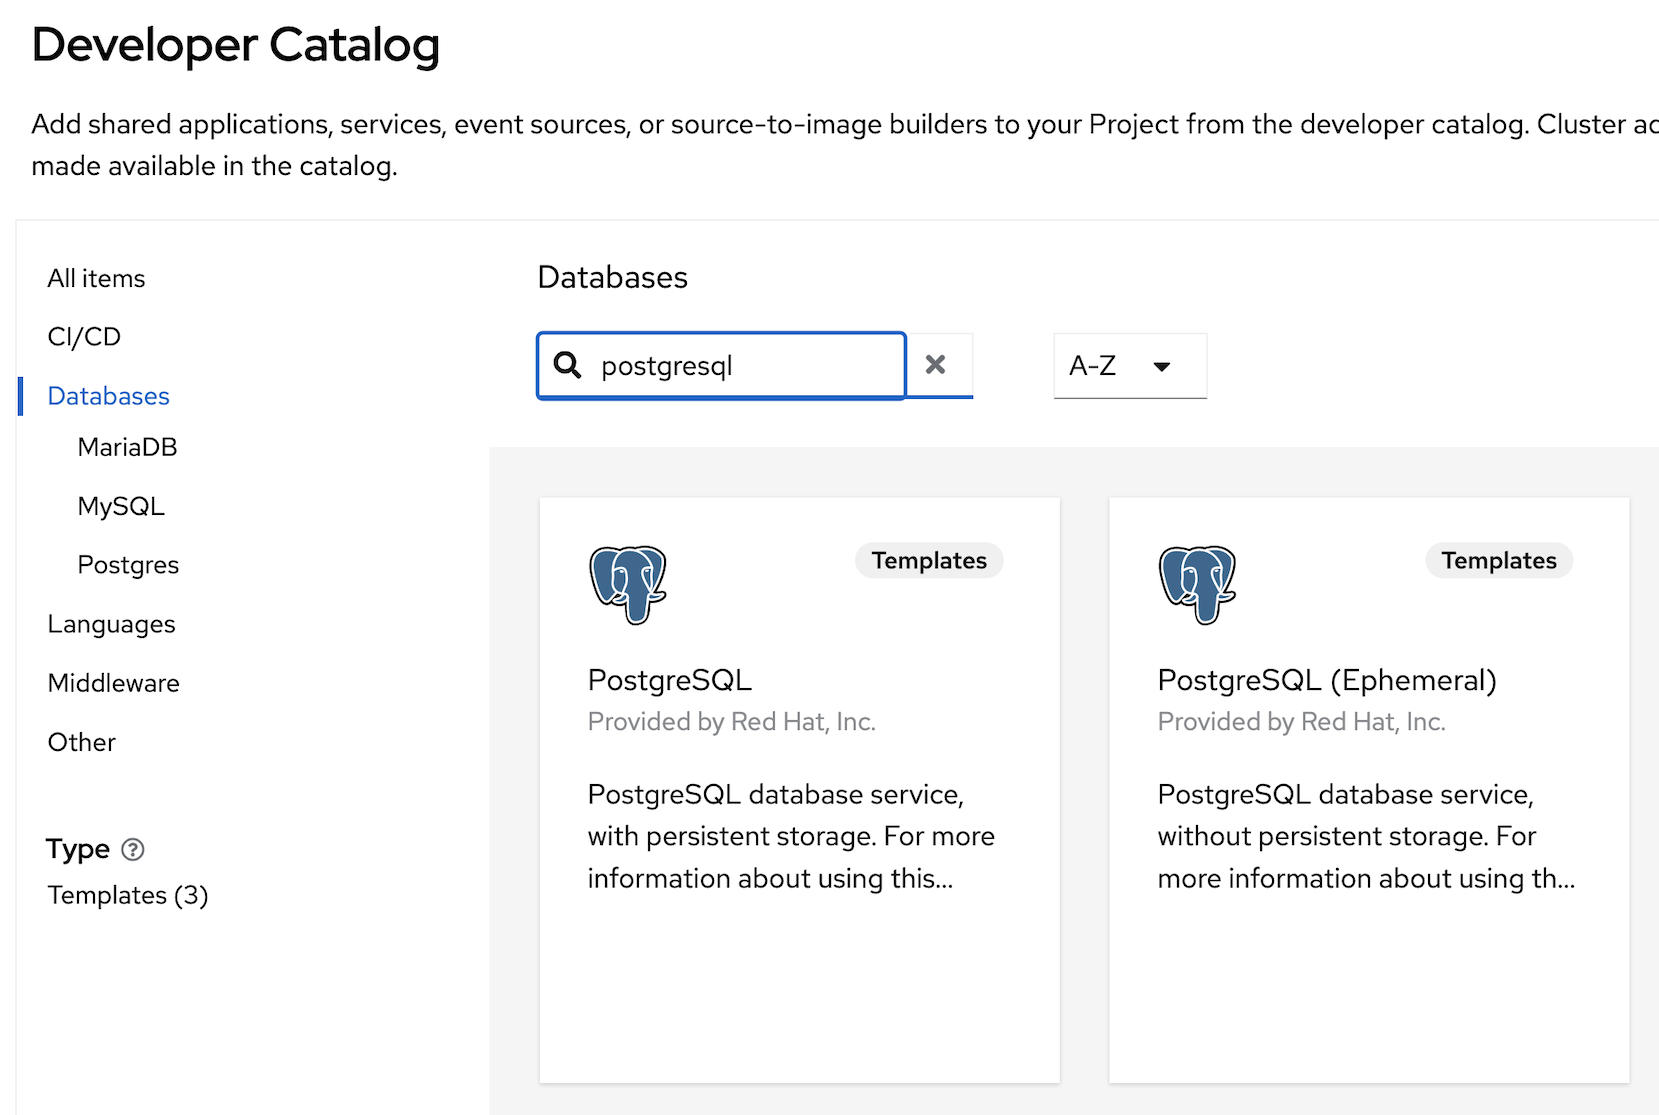
click +Add in left menu, in Developer Catalog, select Database
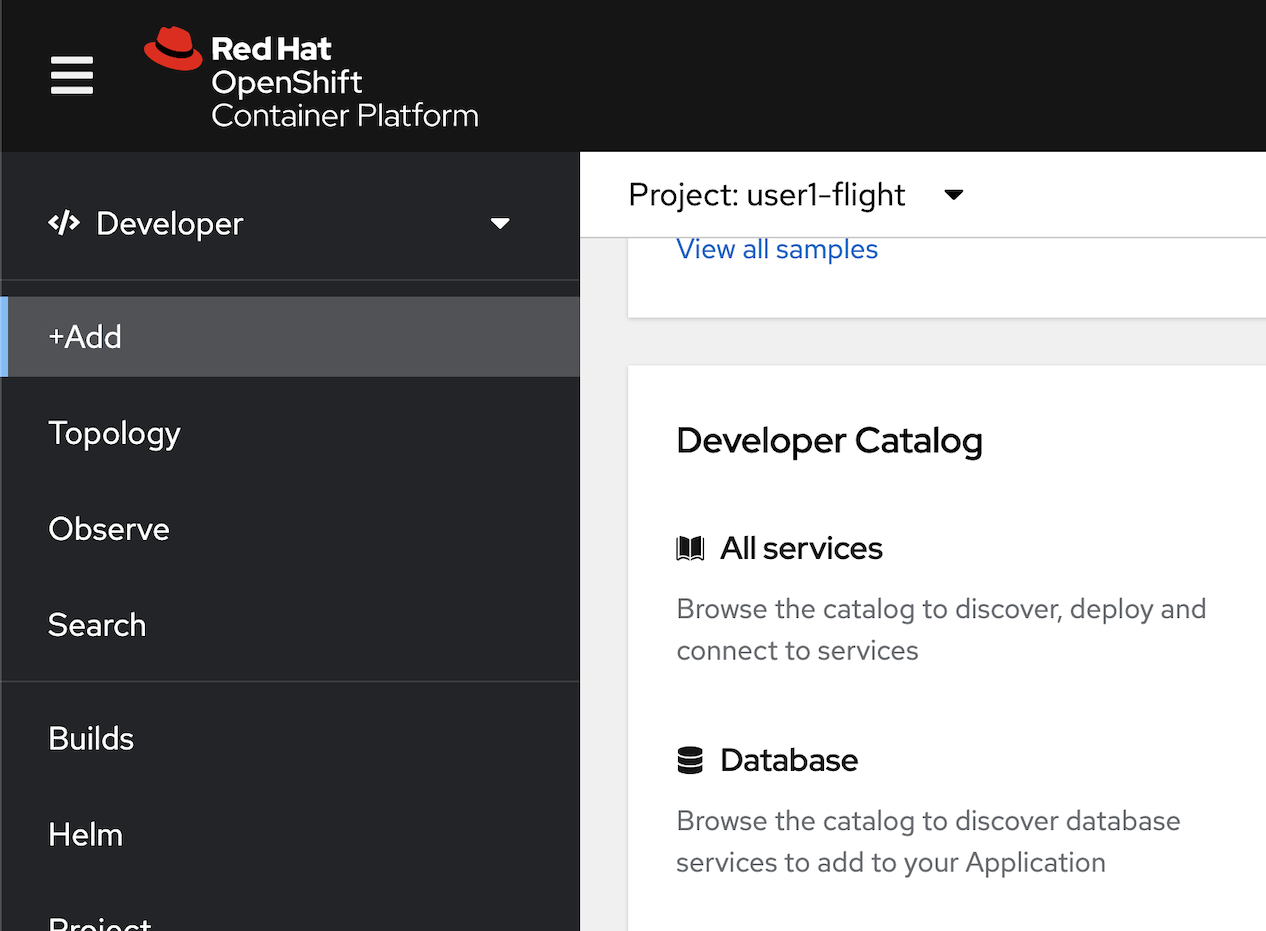
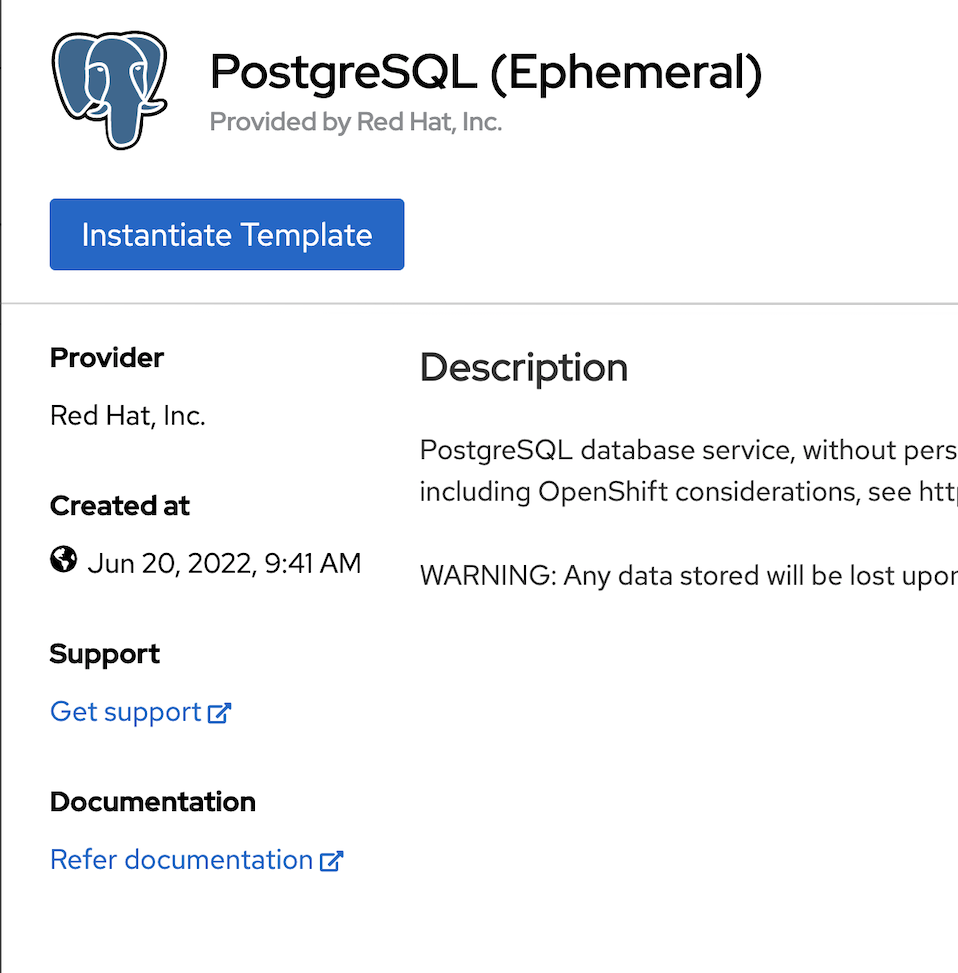
type "postgresql" in search box, select PostgreSQL (Ephermeral)
click Instantiate Template
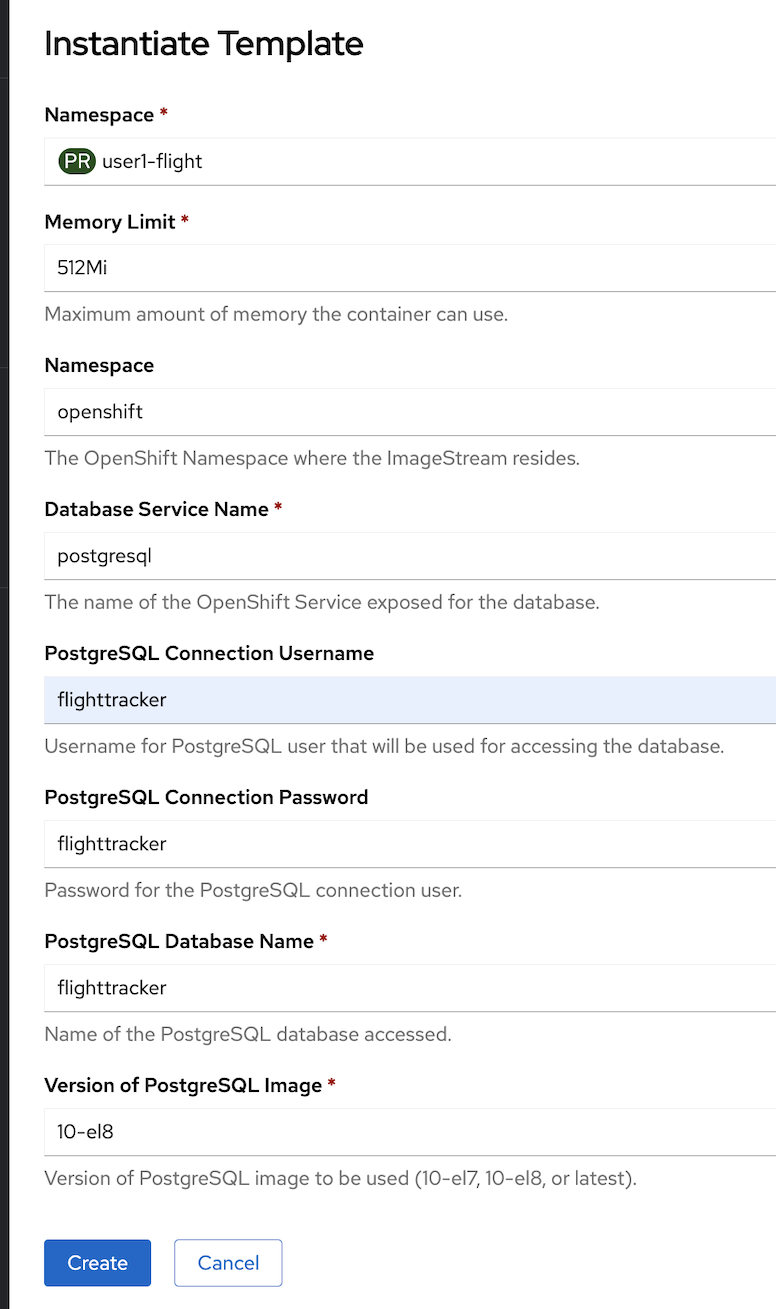
In Instantiate Template page, set value
leave all default except,
| Parameter | Value | | ------------- |:-------------| |Database Service Name| postgresql| |Connection Username| postgresql| |Conneciton Password| postgresql| |Database Name| postgresql|
click create
wait until postgresql change to dark blue circle
Deploy Data-Aggregator from Container Image
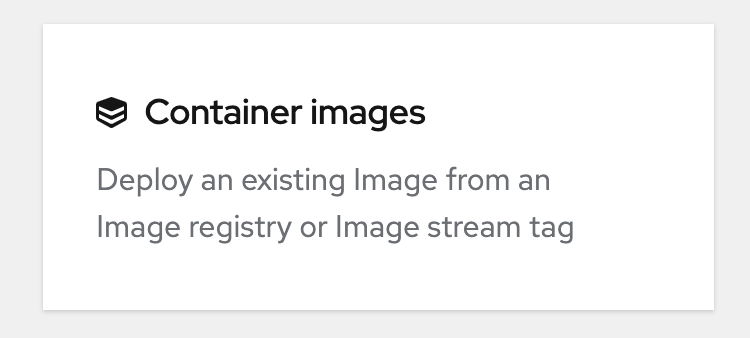
click +Add left menu, select Container images
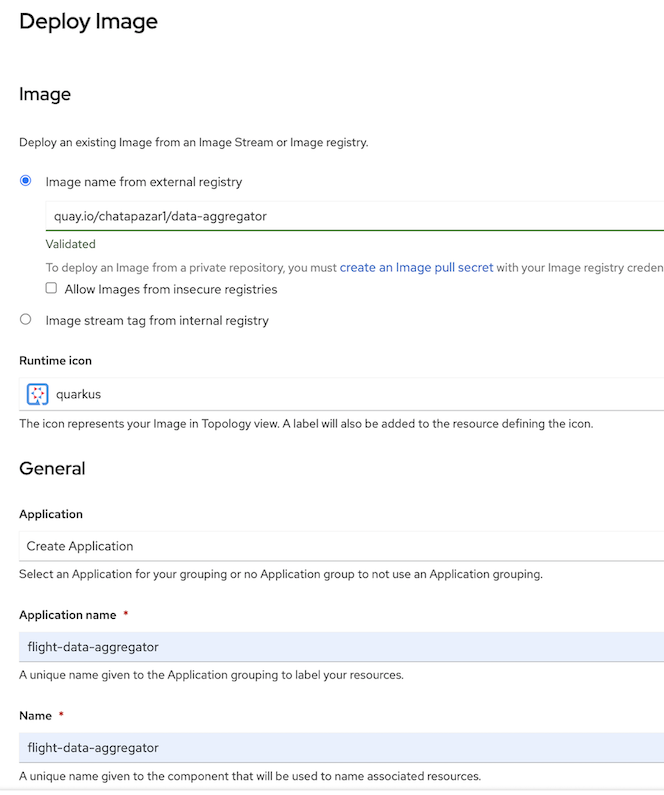
in deploy image page,
- select Image name from external registry
- type "quay.io/chatapazar1/data-aggregator"
- runtime icon: change to quarkus
- Application: select Ceate Application
- Application Name: "flight-data-aggregator"
- Name: "flight-data-aggregator"
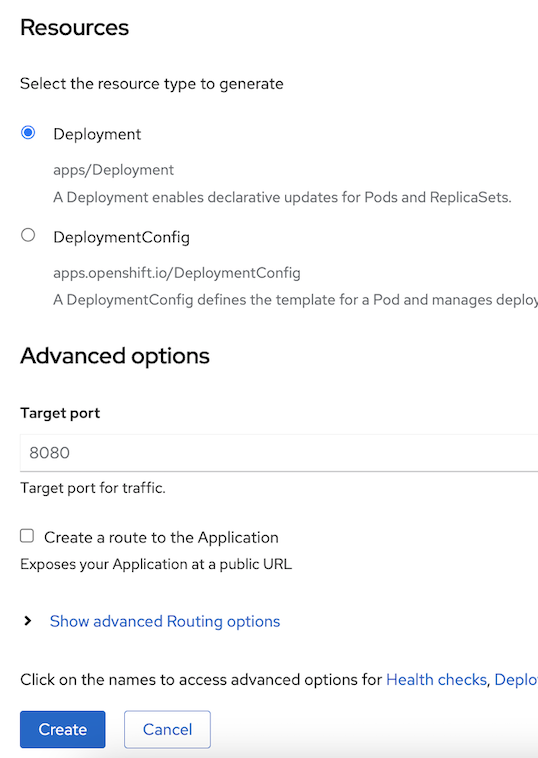
- resource: Deployment
- target port: 8080
- uncheck create a route to the application
click create
Uncheck "Create Route"
wait until flight-data-aggregator circle change to dark blue color
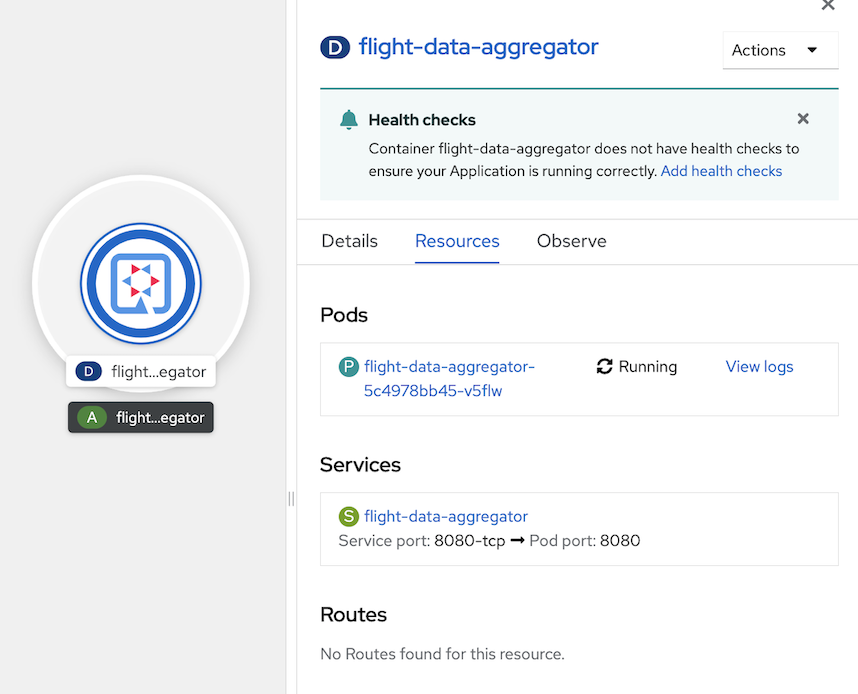
click flight-data-aggregator, select resources tab, click view logs in first port
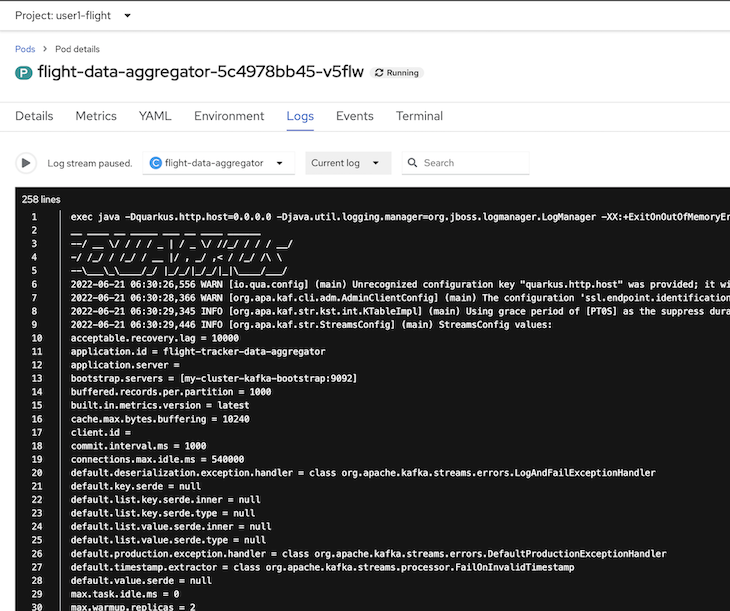
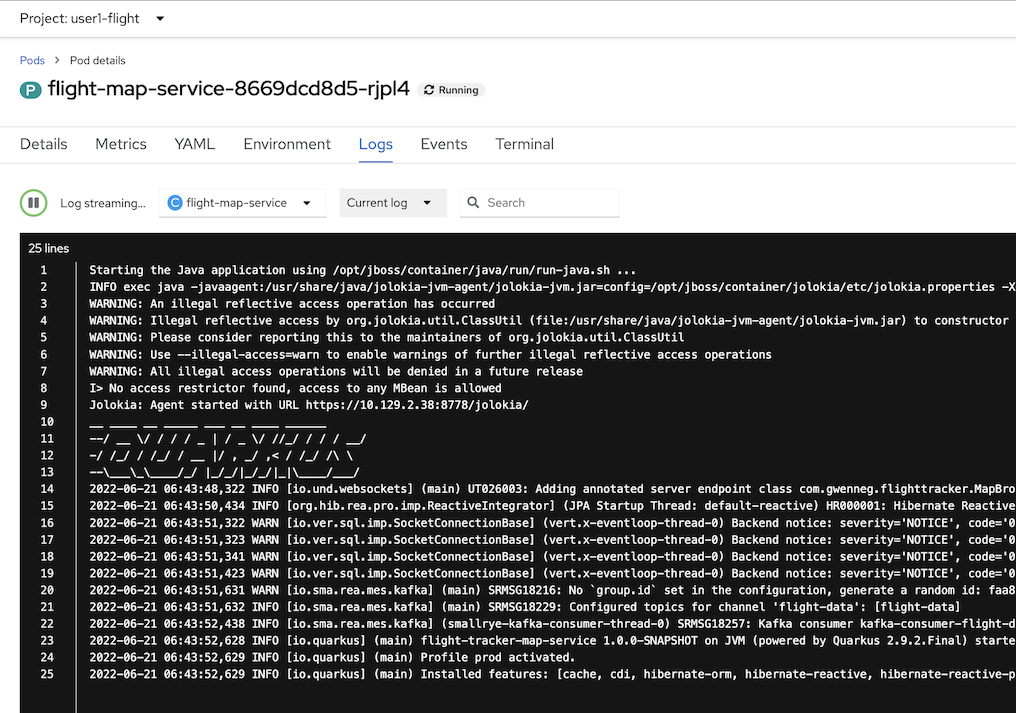
openshift console will display log of flight-data-aggregator, Verify that there are no errors
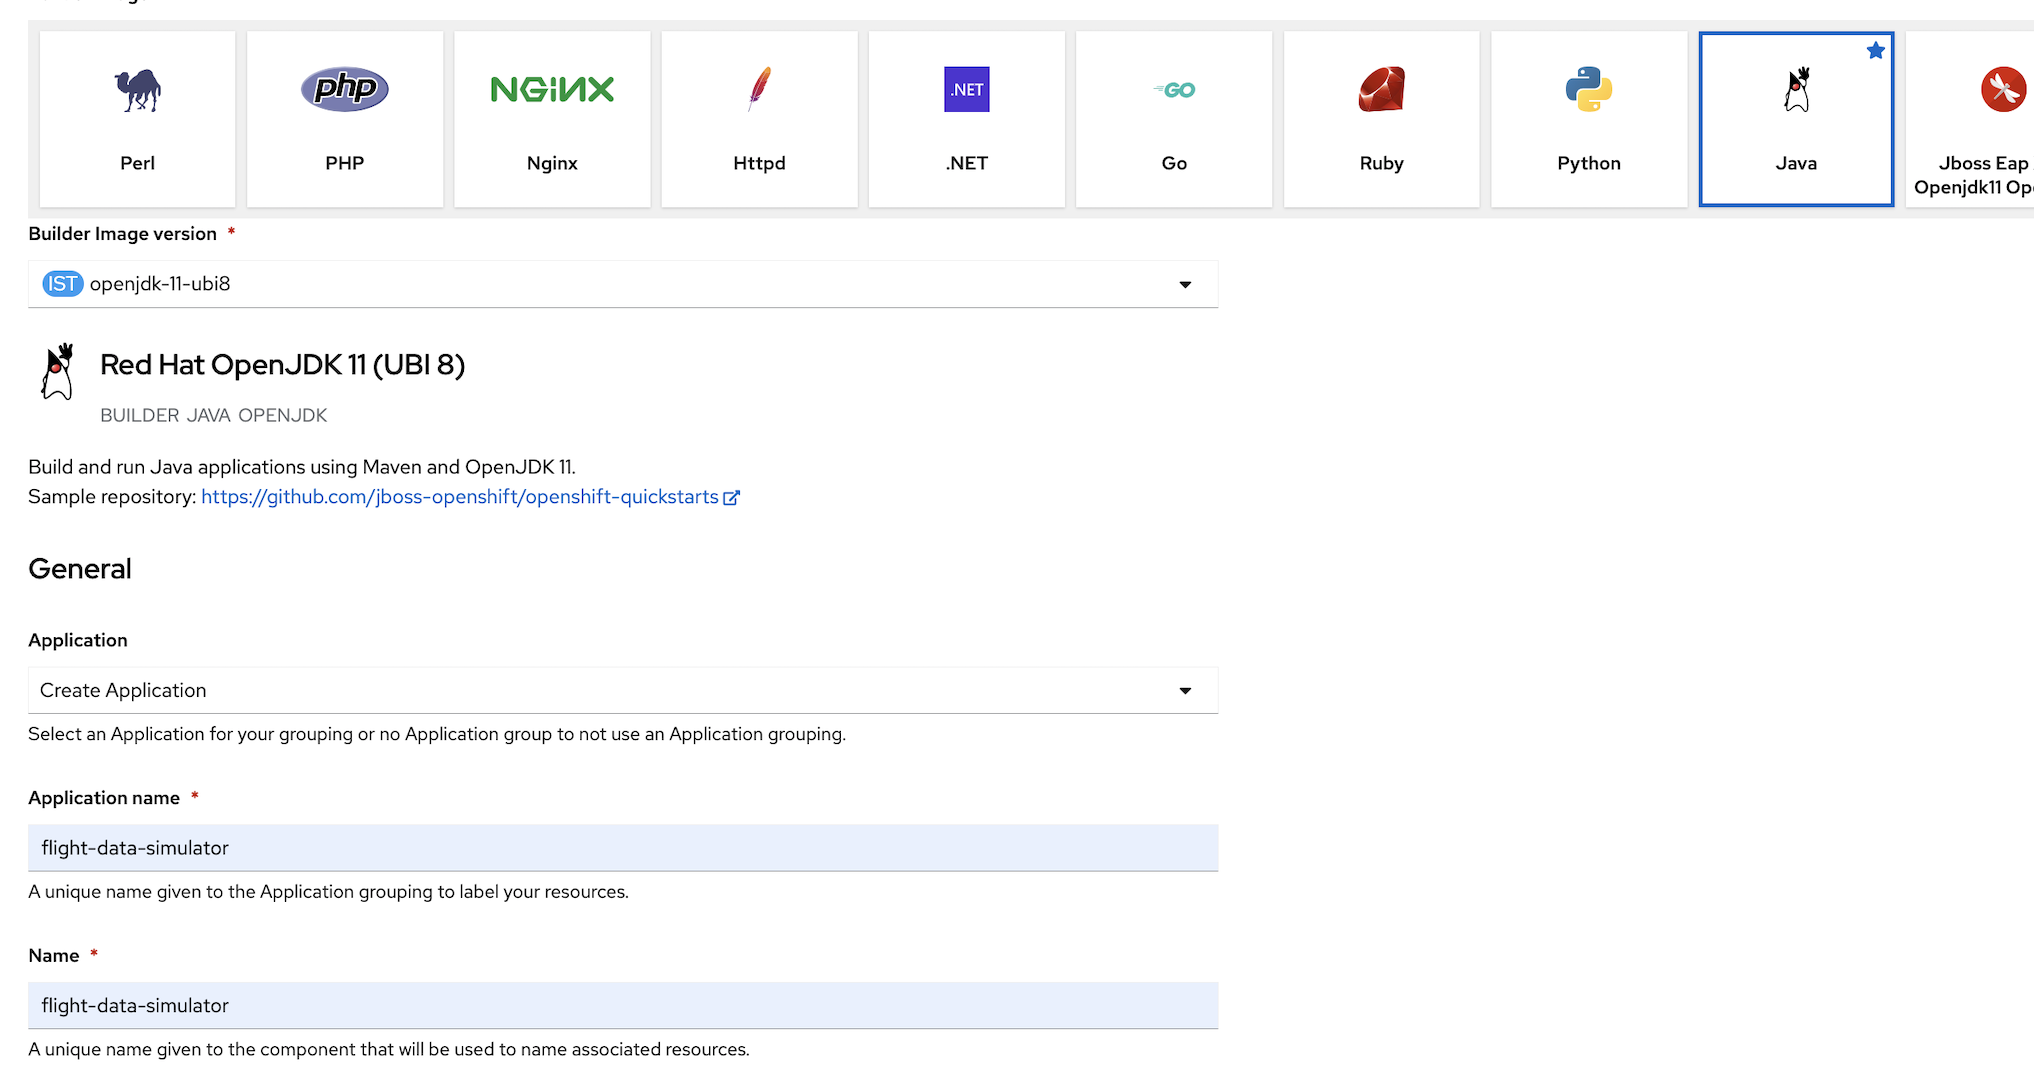
Deploy Data-Simulator from Git Repository (S2I/OpenShift Build)
click +Add in left menu
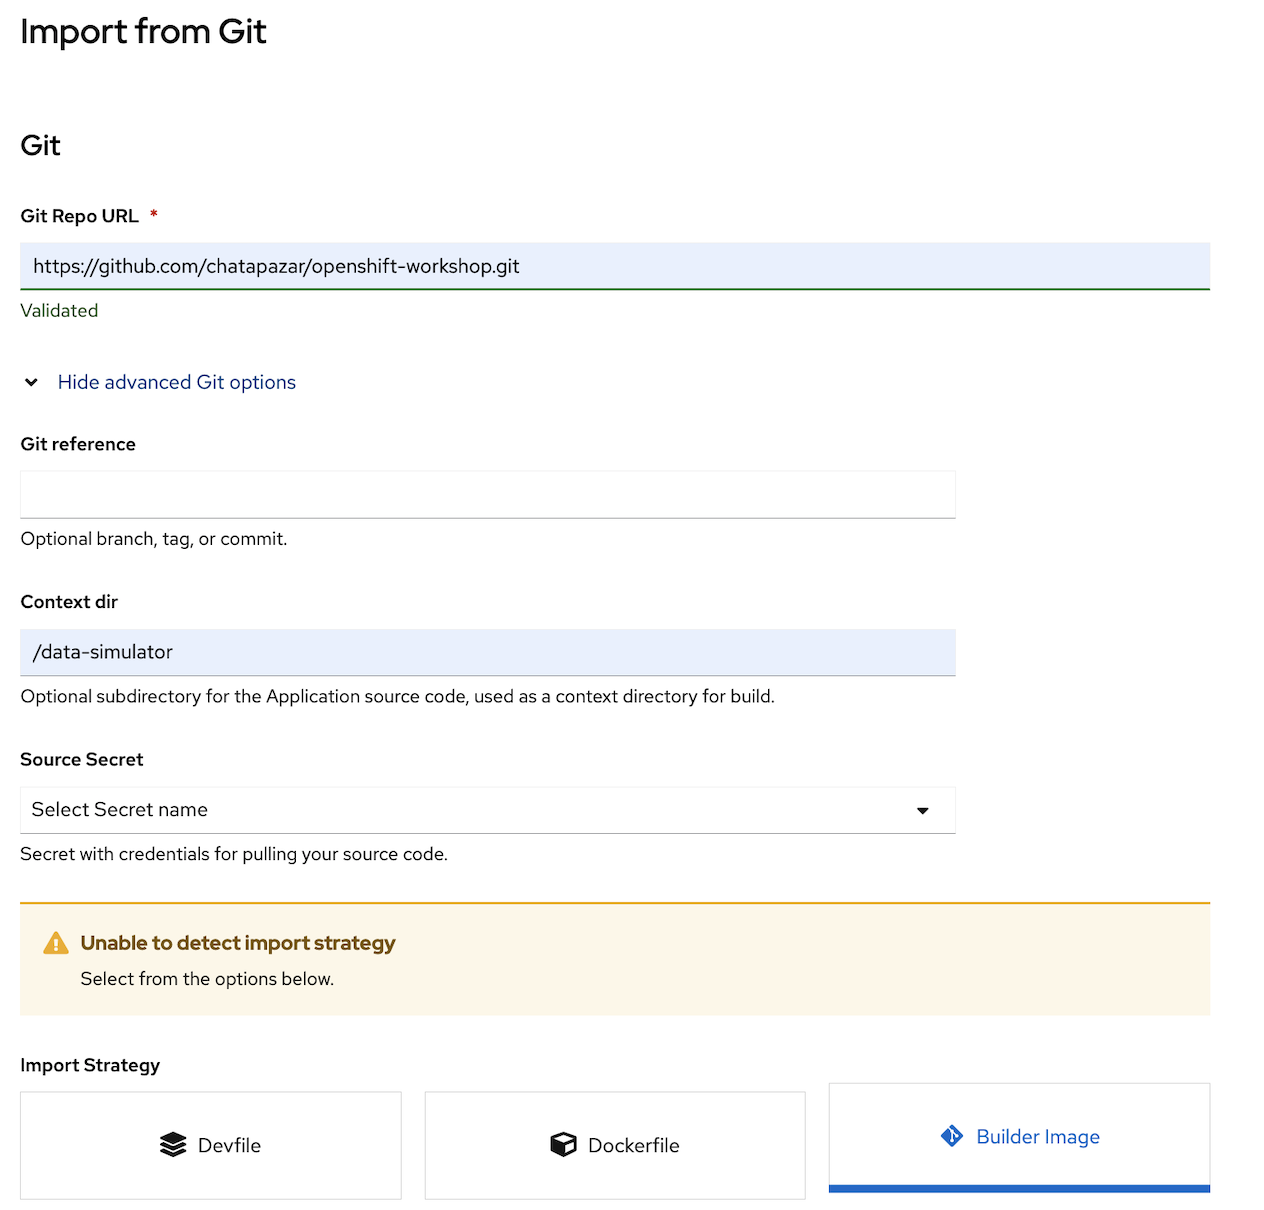
in Import from Git page, set Git Repo URL to : https://gitlab.com/ocp-demo/openshift-workshop
- click show advanced git options
- set Context dir to : /data-simulator
select Import Strategy to Builder Image
select Java
- select Builder Image version to : openjdk-11-ubi8
- in General, Application, select Create Application
- set Application name to : flight-data-simulator
set name to : flight-data-simulator
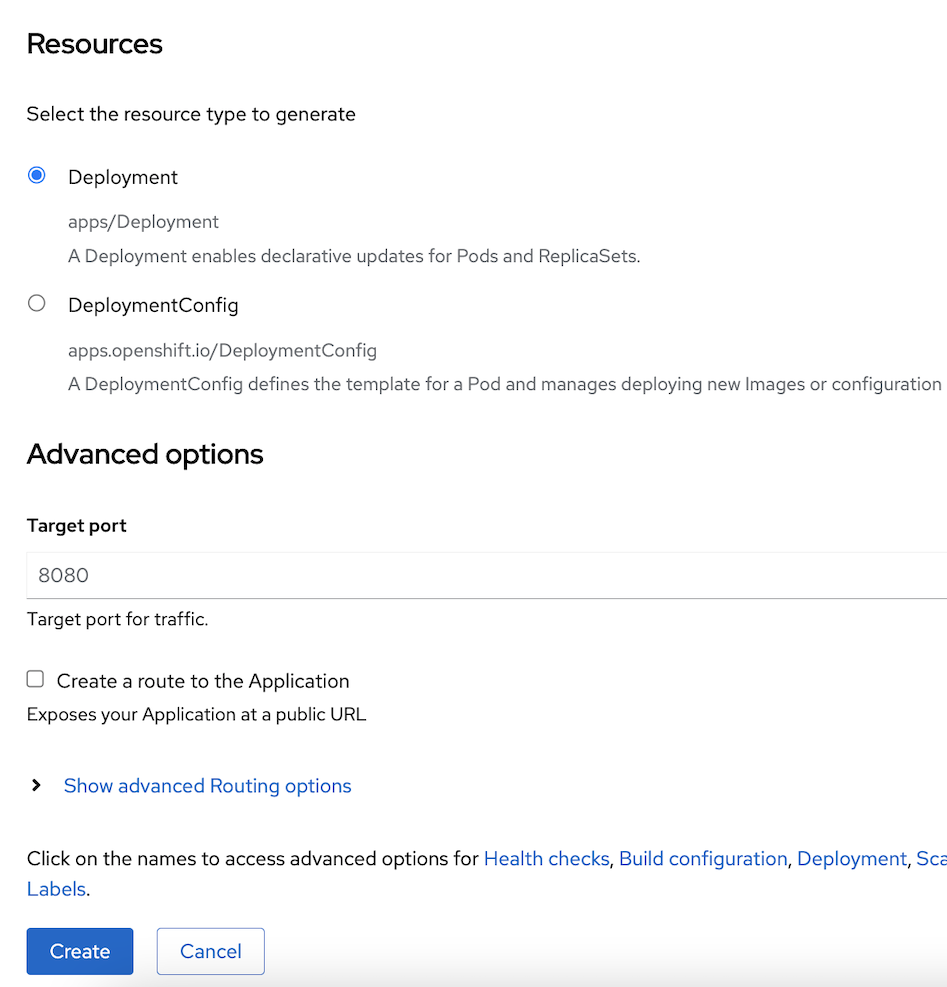
in resources, select deployment
- in advanced options, leave default target port
uncheck create a route to the application and click Create
in Topology view, click circle "(D) flight-data-simulator" for show deployment information popup in right side of developer console
in flight-data-simulator information page, click Resources tab, scroll down to Builds section, wait until Build #1 was complete or click View logs for view s2i build your code to container image
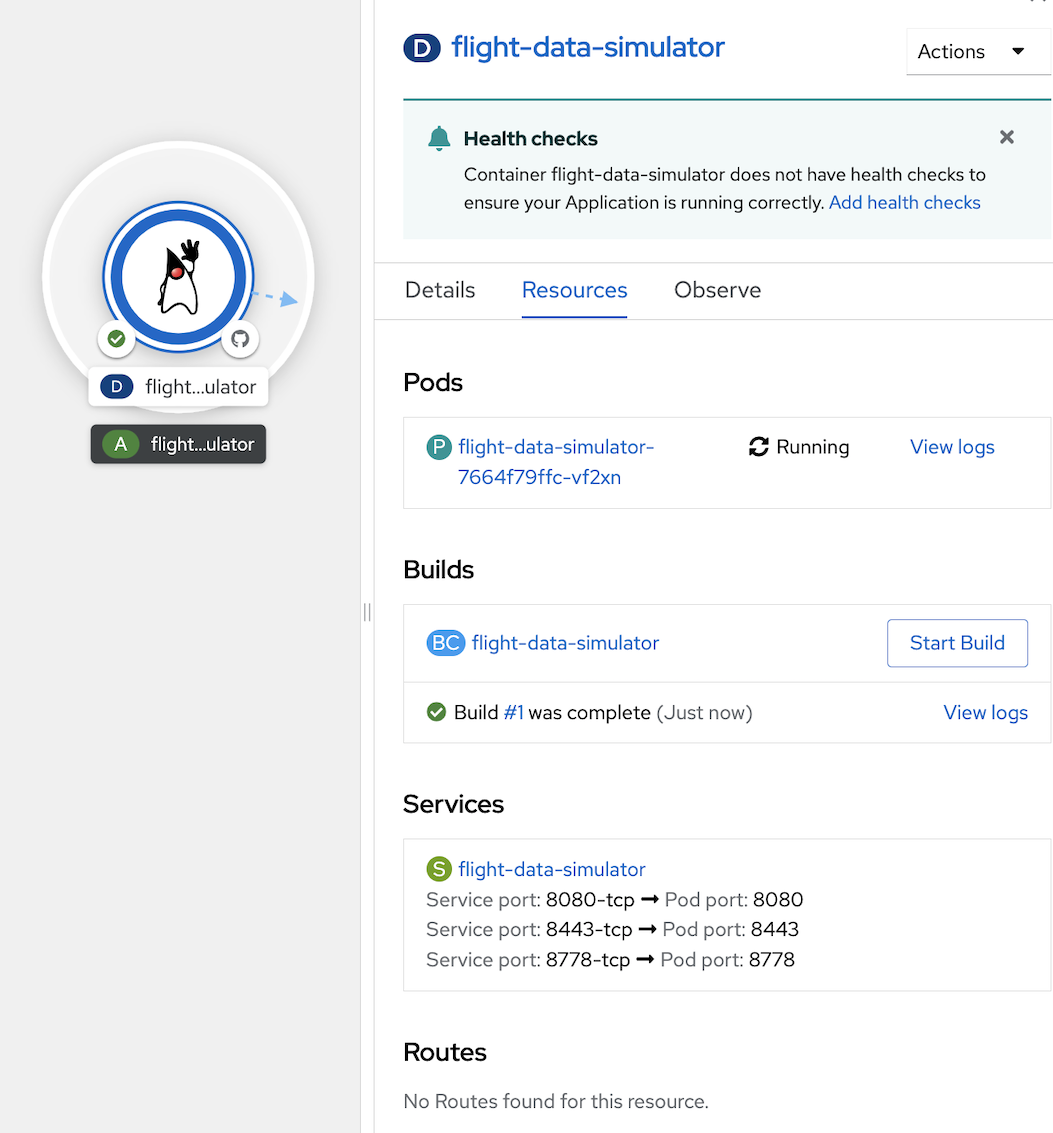
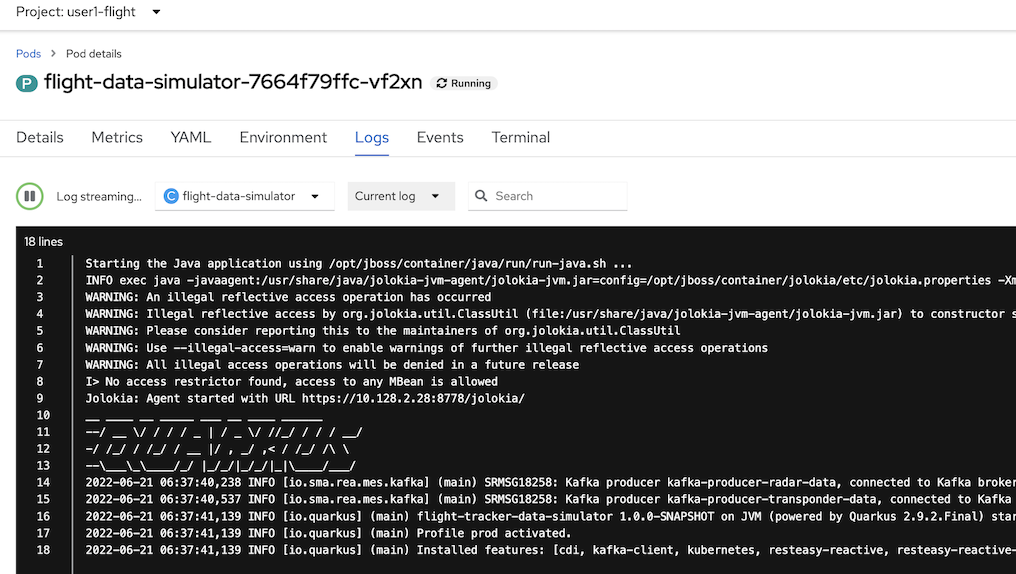
after build complete, flight-data-simulater circle will change to dark blue color, click view logs in Pods section to view application log, Verify that there are no errors
Deploy Map-Service from Git Repository (S2I/OpenShift Build)
- click +Add in left menu, select Import from Git
- in Import from Git page, set Git Repo URL to : https://gitlab.com/ocp-demo/openshift-workshop
- click show advanced Git options
- set Context dir to : /map-service
Import Strategy select Builder Image,
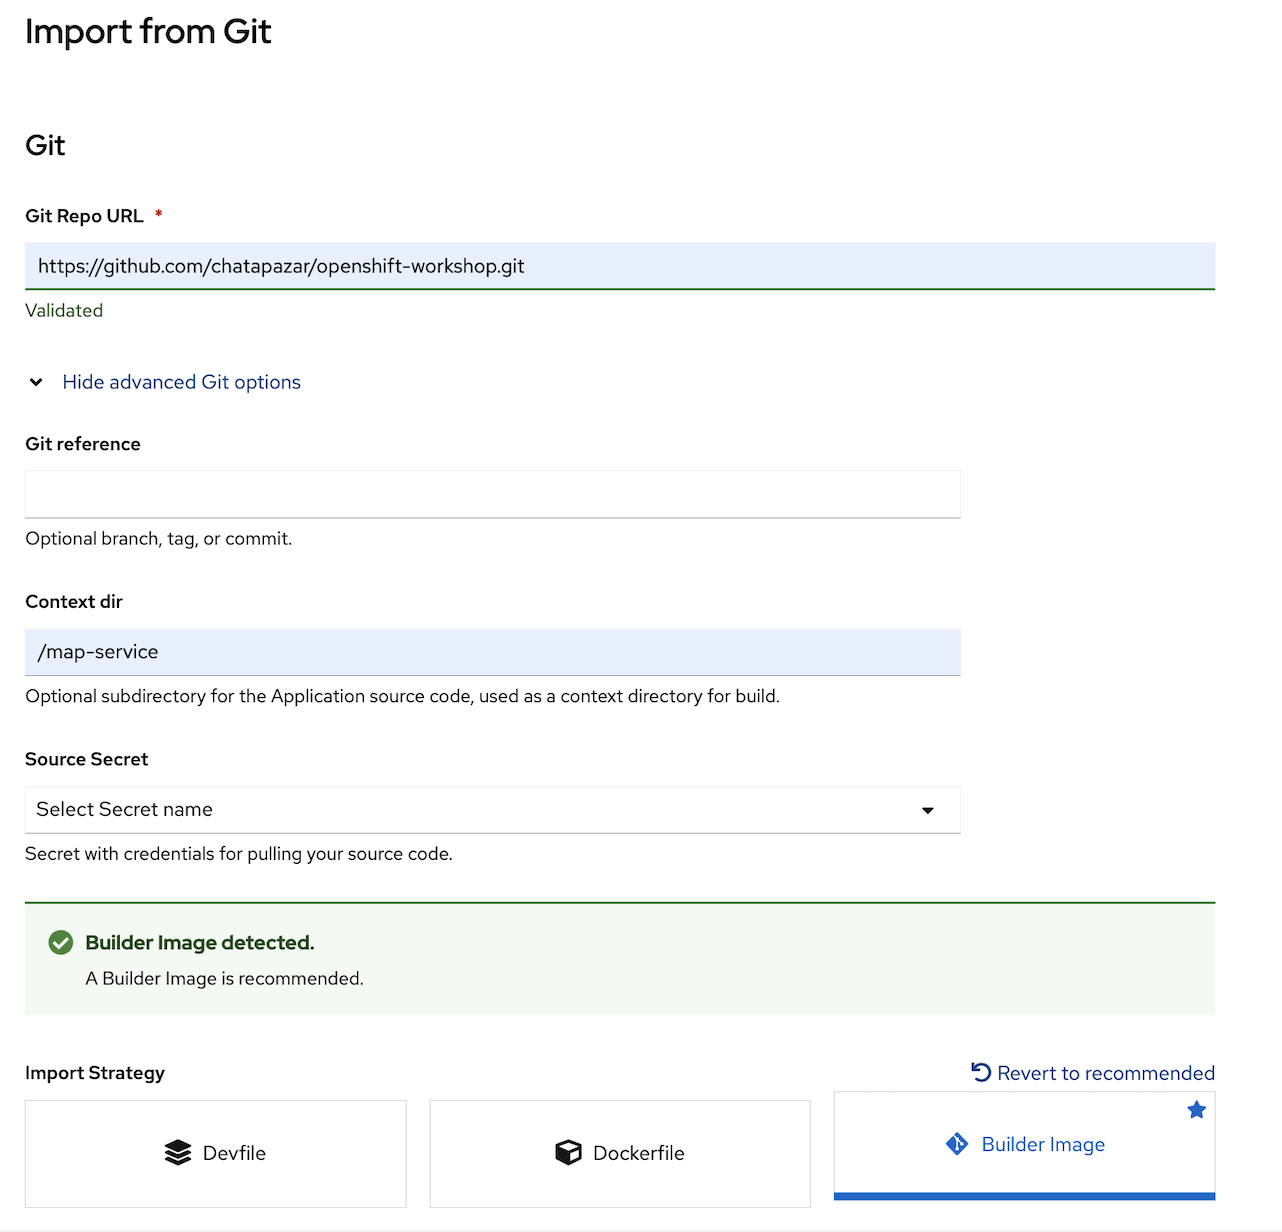
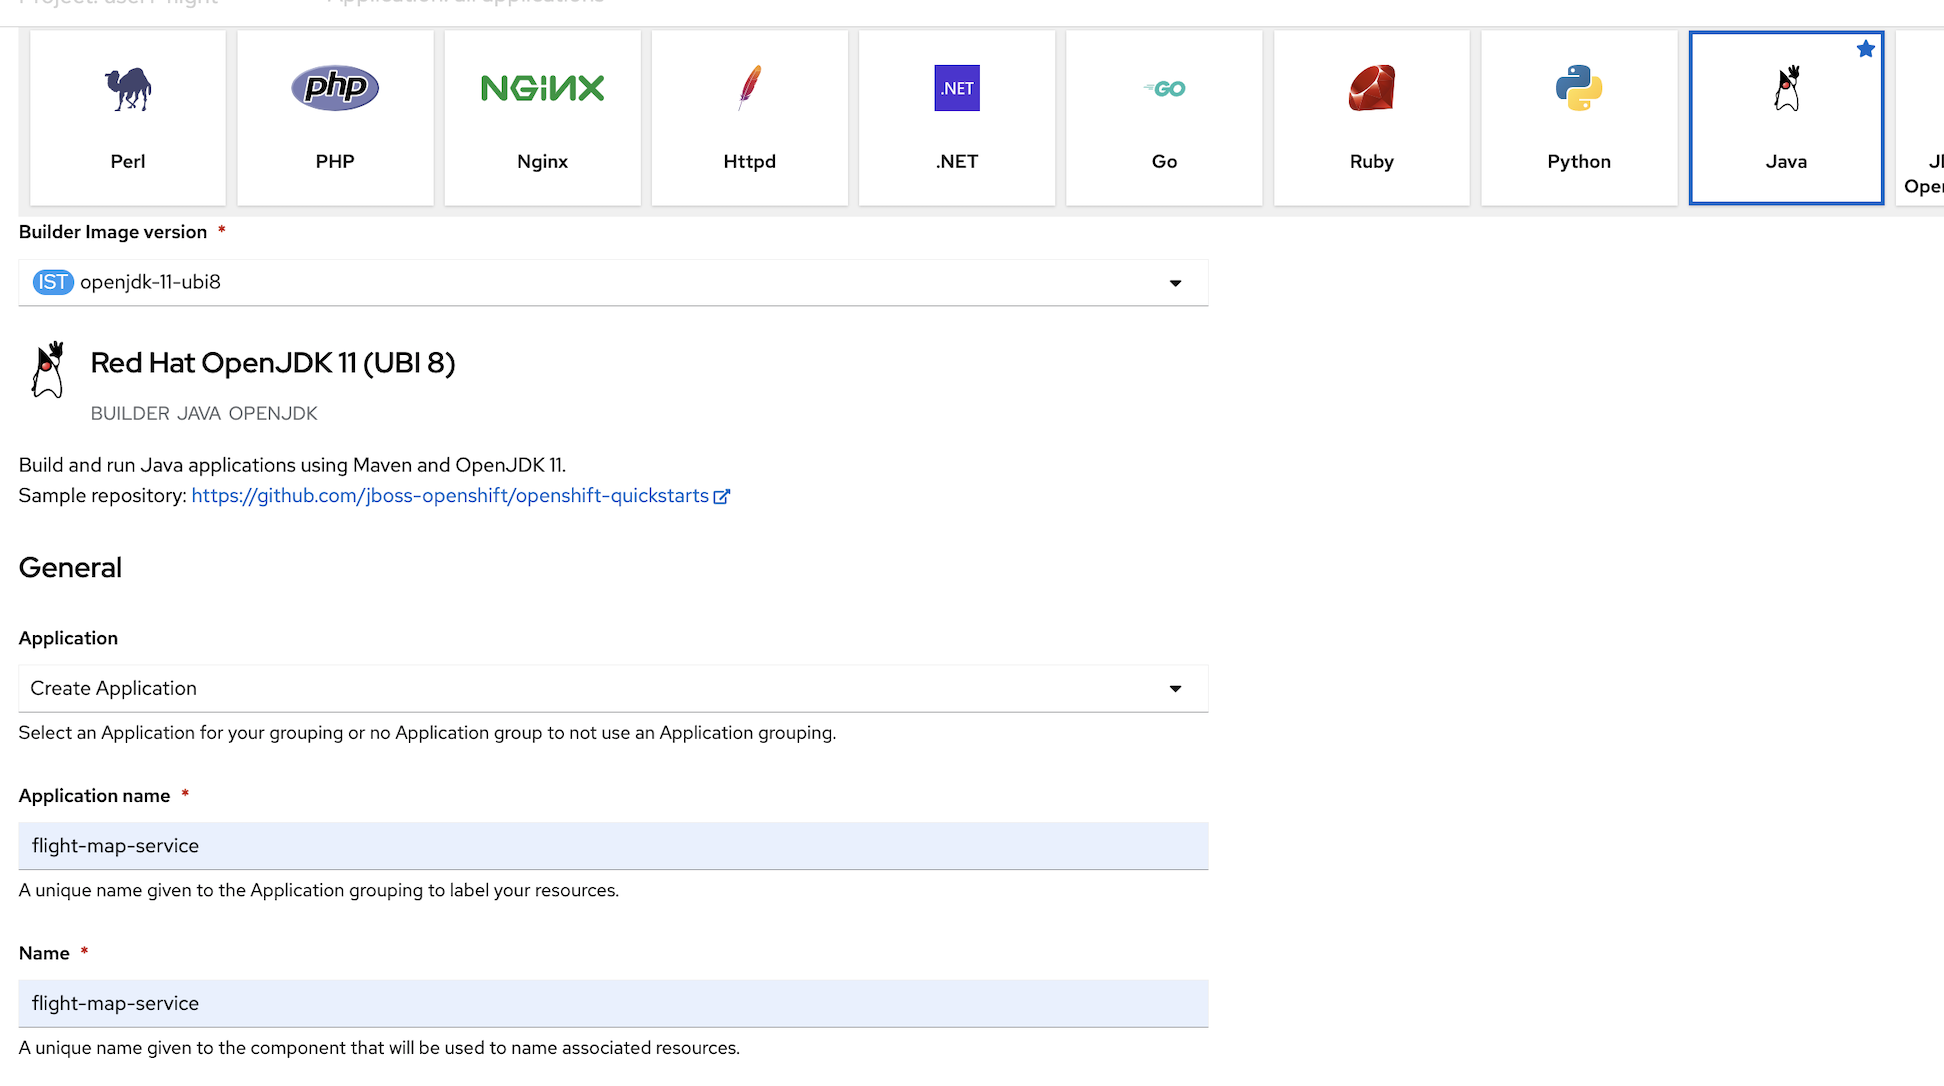
select Java,
- set Builder Image version to : openjdk-11-ubi8
- Application set to Create Application
- Application name: flight-map-service
Name: flight-map-service
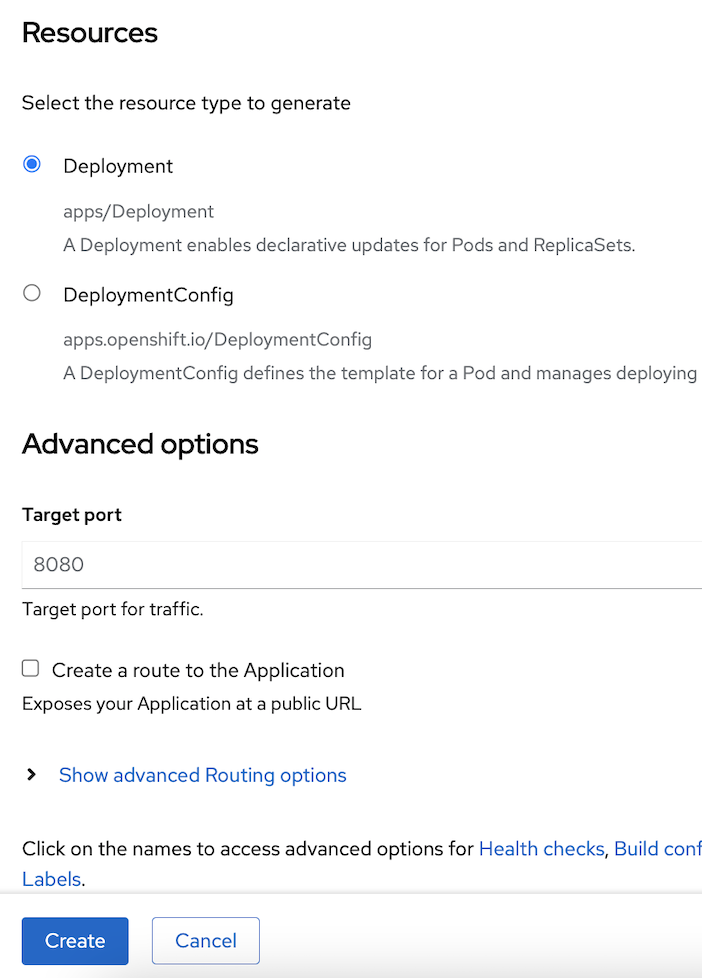
in resources section, select deployment, leave default target port 8080
uncheck Create a route to the Applicaiton, click Create
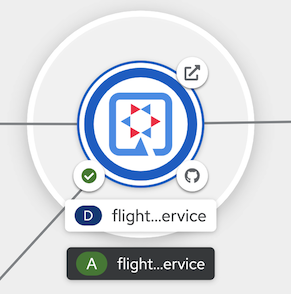
in Topology view, click circle "(D) flight-map-service" for show deployment information popup in right side of developer console
in flight-map-service information page, click Resources tab, scroll down to Builds section, wait until Build #1 was complete or click View logs for view s2i build your code to container image
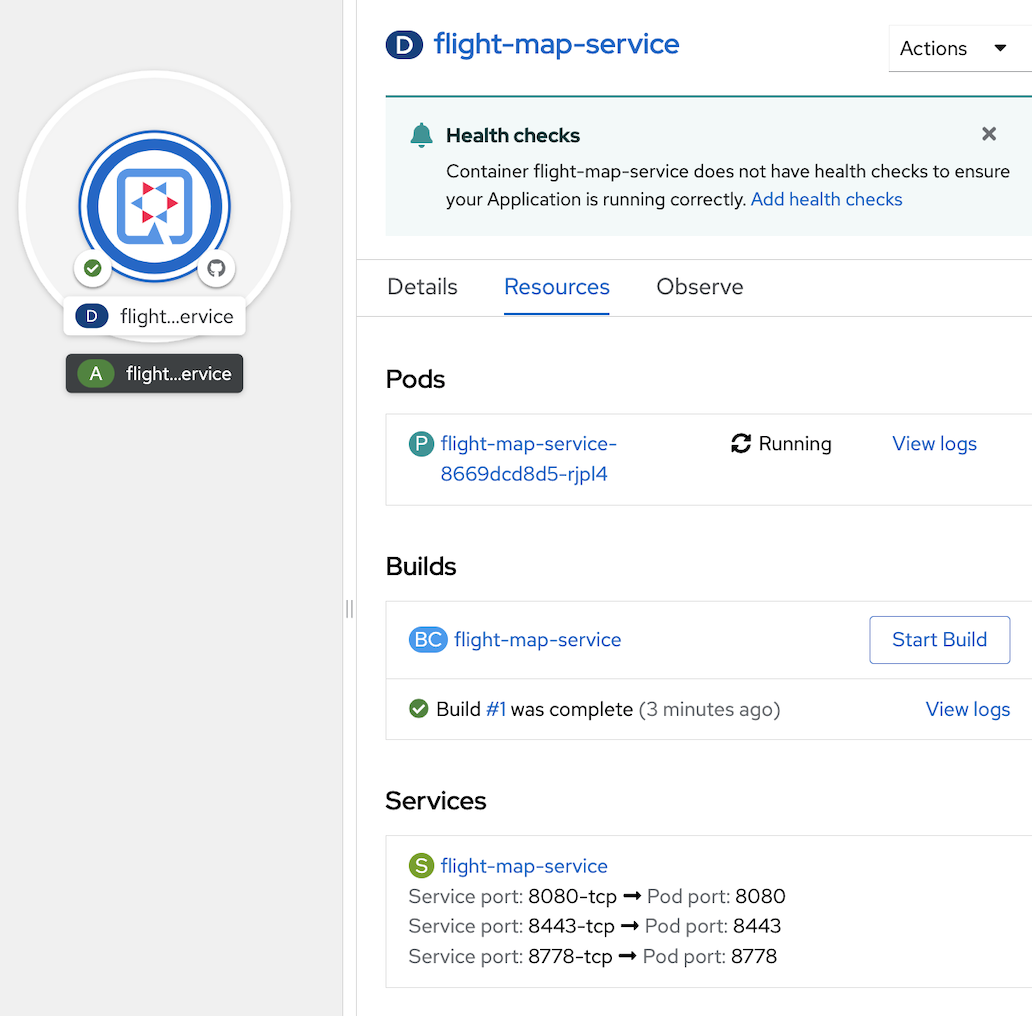
after build complete, flight-data-simulater circle will change to dark blue color, click view logs in Pods section to view application log, Verify that there are no errors
Create Route for flight-map-service
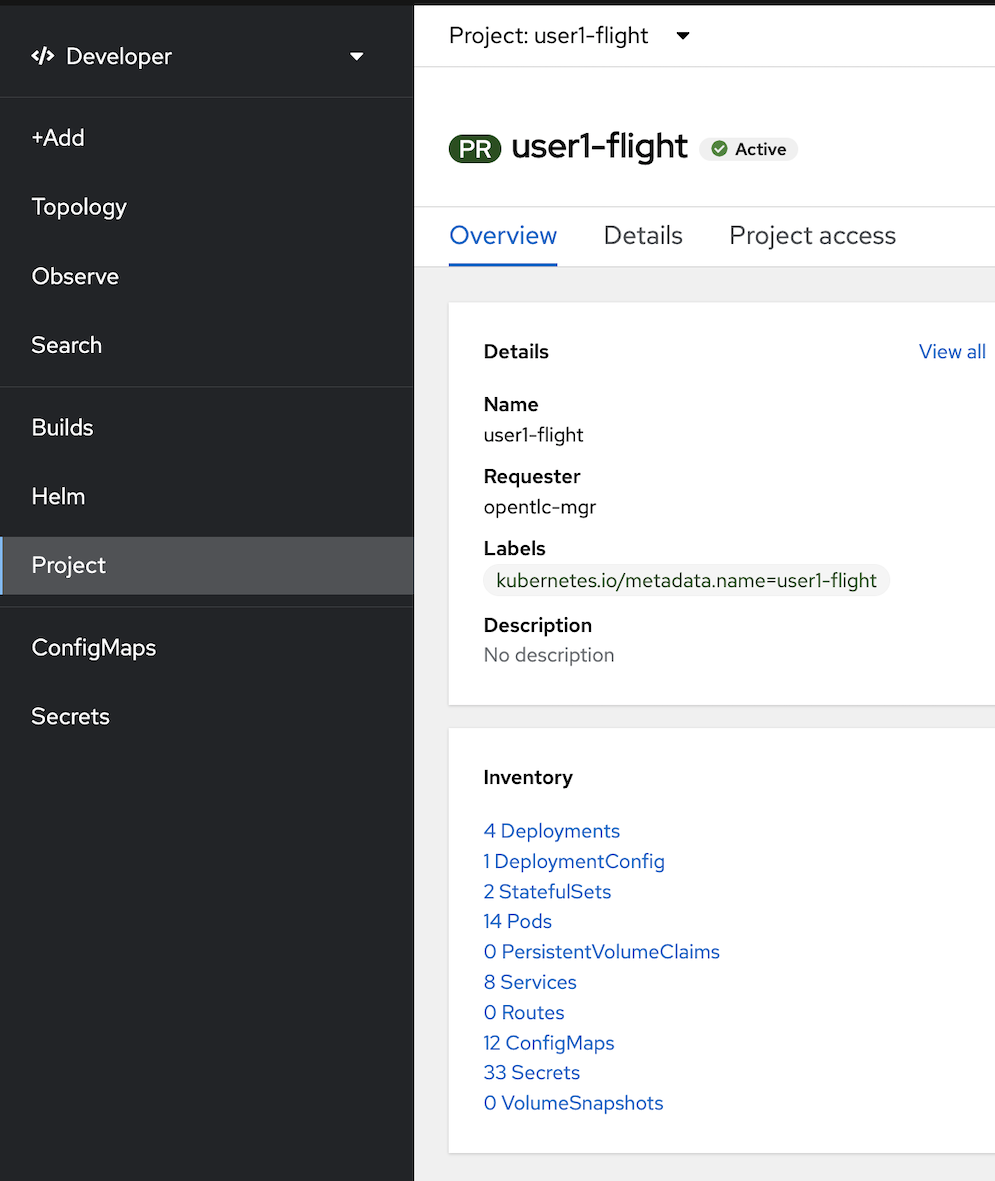
- click Project in left menu, select Project: \
-flight in Overview tab, scroll down to Inventory section, select Route
in Route page, click Create Route
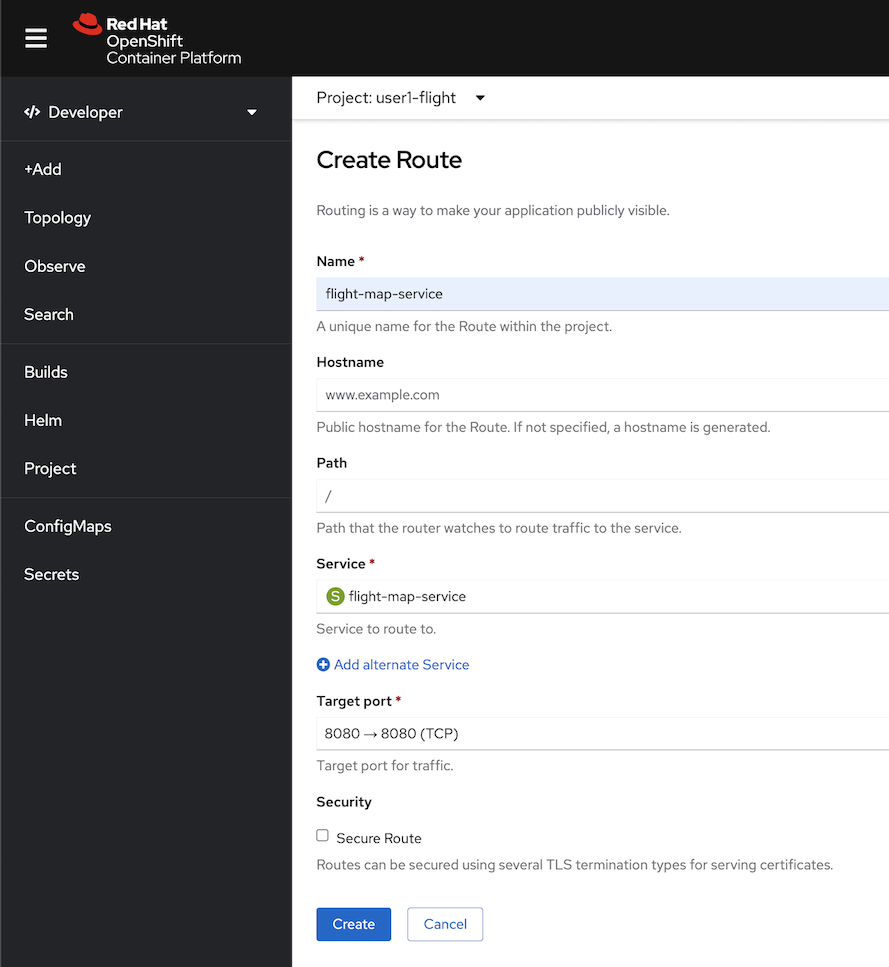
in create route page, leave all default except:
- name: flight-map-service
- Service: select flight-map-service
- target port: 8080-->8080(TCP)
uncheck secure route, click create
back to topology view, in flight-map-service, You will see a route icon in the top right corner of flight-map-service circle (or click flight-map-service circle and see details in flight-map-service deployment information page, resources tab)
- click Project in left menu, select Project: \
(Optional) Change Icon and Add Connection Info in Topology (add more information in Topology)
- back to Topology view (click Topology in left menu)
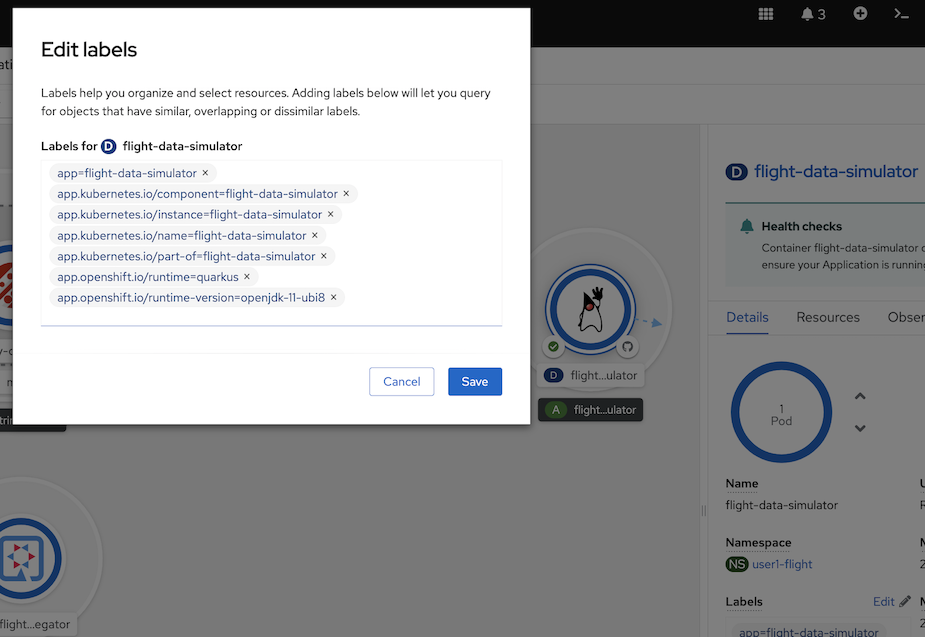
- click flight-data-simulator circle, in (D) flight-data-simulator deployment information, select details tab
- scroll down to Labels section click edit link
- in edit labels popup, remove label "app.openshift.io/runtime=java" (click x icon)
- type "app.openshift.io/runtime=quarkus" to add new icon to this deployment, click save
verify flight-data-simulator change icon from duke to quarkus
Repeat with the other components as follows:
- flight-map-service, remove label "app.openshift.io/runtime=java", add label "app.openshift.io/runtime=quarkus"
- postgresql, add label "app.openshift.io/runtime=postgresql"
add connection to topology (For cosmetic purposes only, not a real conneciton between components.), click web terminal icon at top right conner (">_" icon)

wait until command line terminal show in buttom of developer console
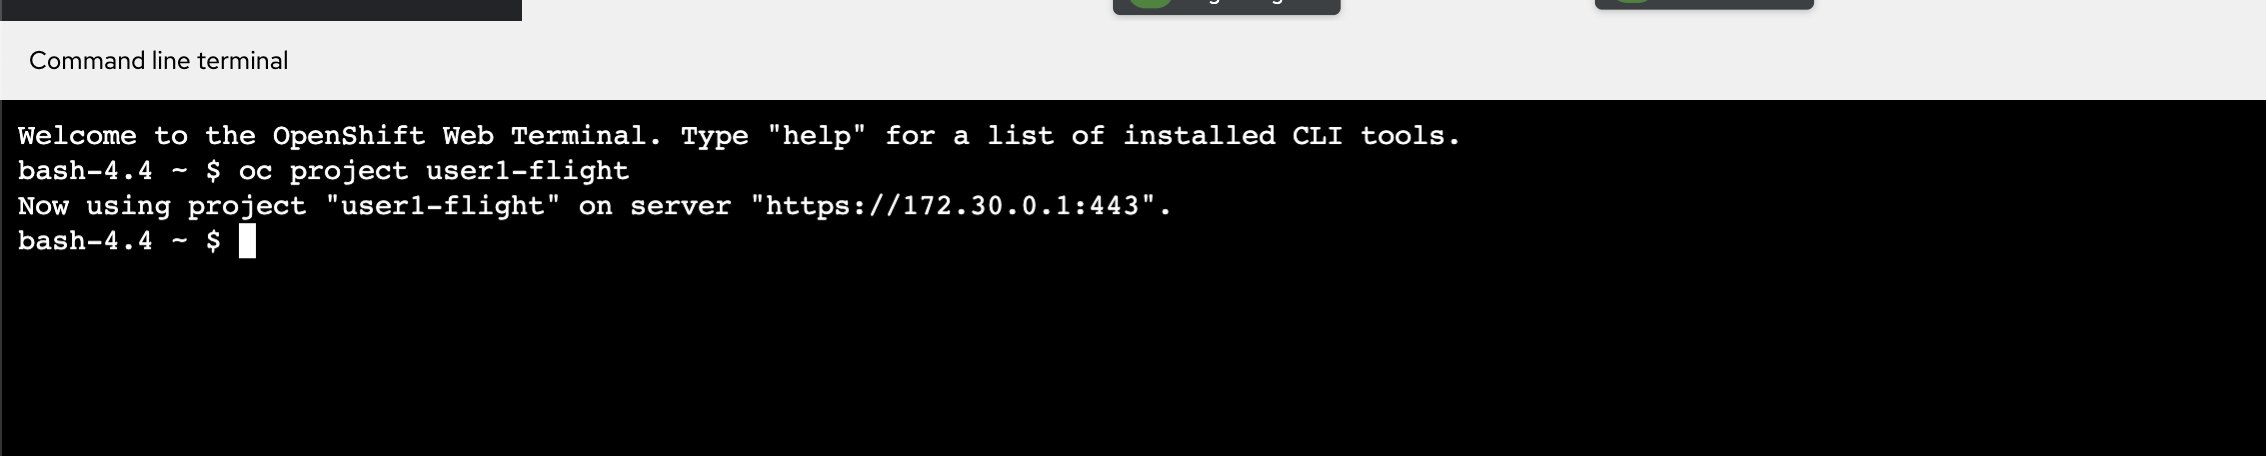
set current project to your project ('\
-flight') such as user1-flight oc project <your username>-flightsample output
Now using project "user1-flight" on server "https://172.30.0.1:443".set connection with oc annotate command, type below command in web terminal
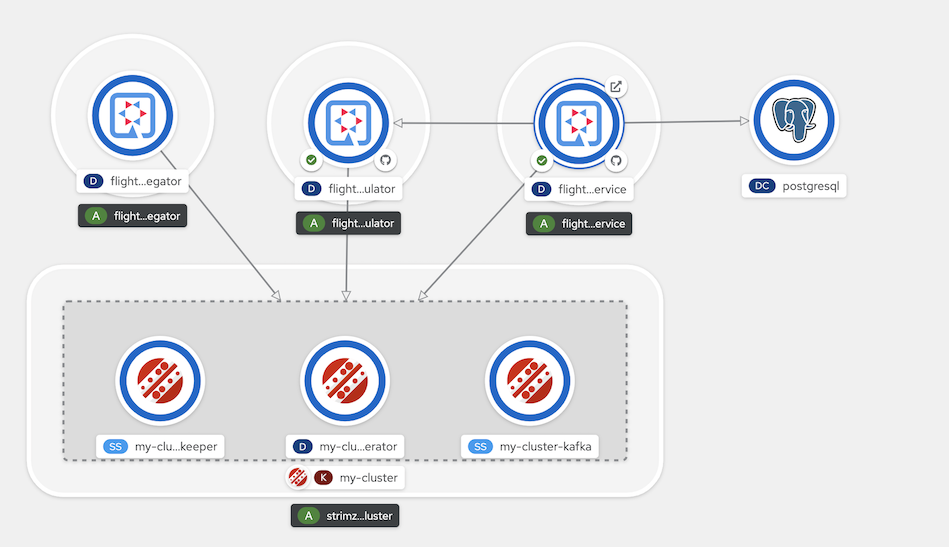
oc annotate deployment flight-map-service 'app.openshift.io/connects-to=[{"apiVersion":"apps.openshift.io/v1","kind":"DeploymentConfig","name":"postgresql"},{"apiVersion":"apps/v1","kind":"Deployment","name":"flight-data-simulator"},{"apiVersion":"kafka.strimzi.io/v1beta2","kind":"Kafka","name":"my-cluster"}]'
oc annotate deployment flight-data-simulator 'app.openshift.io/connects-to=[{"apiVersion":"kafka.strimzi.io/v1beta2","kind":"Kafka","name":"my-cluster"}]'
oc annotate deployment flight-data-aggregator 'app.openshift.io/connects-to=[{"apiVersion":"kafka.strimzi.io/v1beta2","kind":"Kafka","name":"my-cluster"}]'
check result in topology view
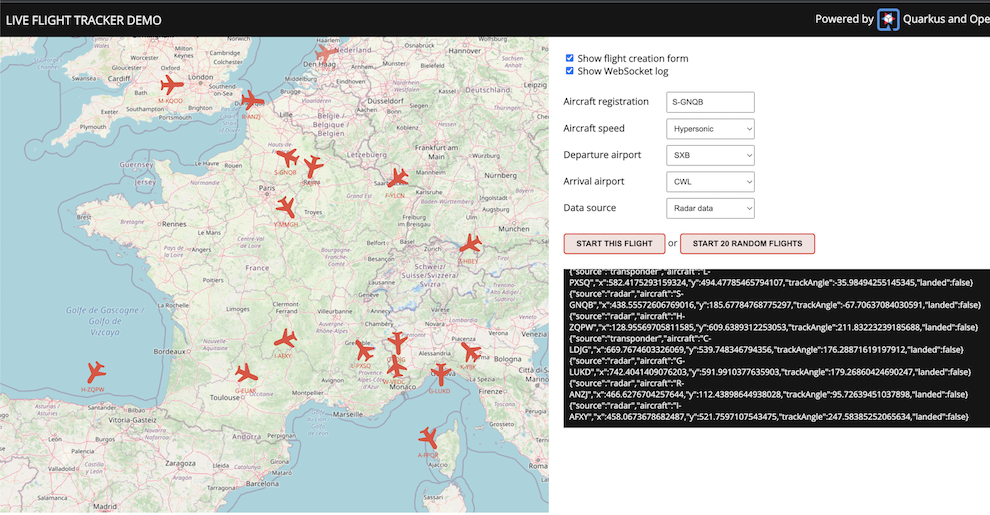
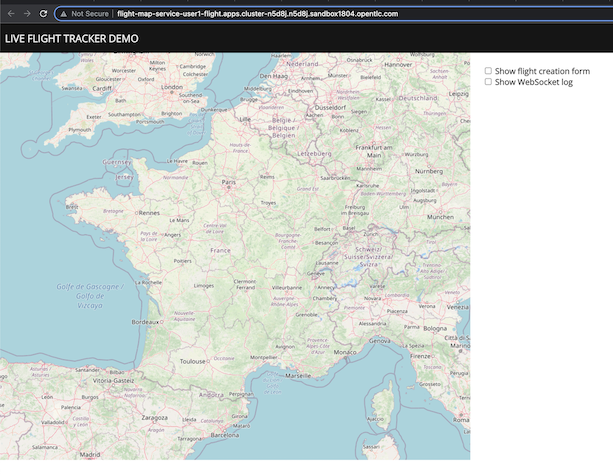
Test Live Flight Track Demo
- in topology view, click route icon of flight-map-service for open web application
browser will show Live Flight Tracer demo
click checkbox show slifht creation form and show websocket log
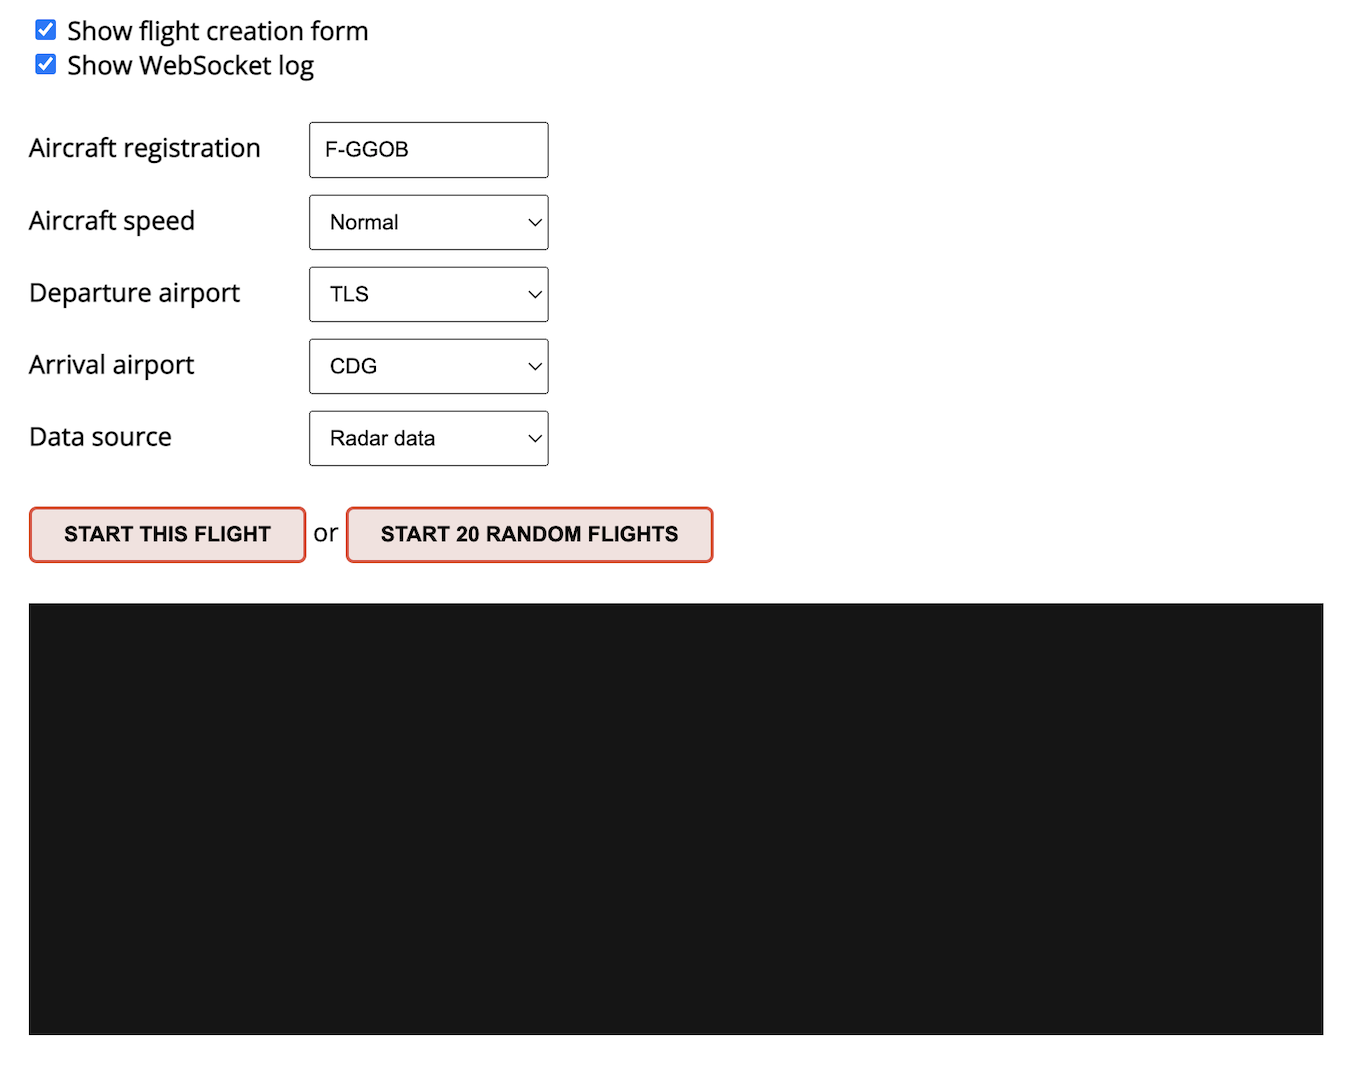
click start this flight button or start 20 random flights button and see simulation in your browser